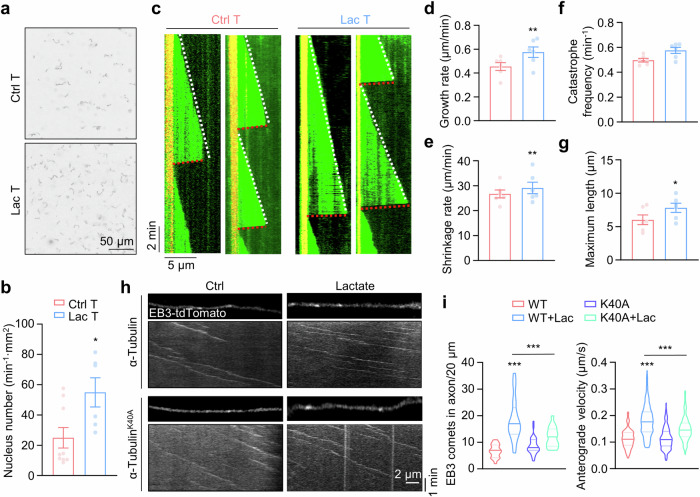
Fig. 5. α-Tubulin lactylation promotes microtubule polymerization and dynamics.
a Representative images of tubulin nucleation assay using 15 μM native or in vitro lactylated α-tubulin. Free tubulin comprising unlabeled and HiLyte-488-tubulin at a 9:1 ratio were incubated with 1 mM GTP and 5% glycerol at 37 °C for 30 min. b Quantitative analysis of data in (a). Ctrl T, n = 9; Lac T, n = 6. Two-sided unpaired student’s t-test, p = 0.0210. c Representative Kymographs of dynamic microtubules from α-tubulin or lactylated-α-tubulin by time-lapse imaging with TIRF microscopy. Quantitative analysis of microtubule growth rate in (d), shrinkage rate in (e), catastrophe frequency in (f), and maximum length in (g). n = 6 experiments. Two-sided paired student’s t-test, for growth rate, p = 0.0026; for shrinkage rate, p = 0.0042; for maximum length, p = 0.0295. h Representative images and kymographs of EB3-tdTomato in cultured hippocampus neurons at DIV3. The neurons were transfected with EB3-tdTomato together with α-tubulin or α-tubulin K40A mutant, were then cultured with or without 30 mM lactate. i Quantitative analysis of number of EB3 comets and anterograde velocity. EB3 comets: WT, n = 20; WT + Lac, n = 21; K40A, n = 31; and K40A + Lac, n = 17 neurons from 3 experiments. Anterograde velocity: WT, n = 112; WT + Lac, n = 301; K40A, n = 194; and K40A + Lac, n = 236 EB3 comets from 3 experiments. One-way ANOVA, for EB3 comets, WT + Lac vs WT, p < 0.0001; K40A + Lac vs WT + Lac, p < 0.0001. For anterograde velocity, WT + Lac vs WT, p < 0.0001; K40A + Lac vs WT + Lac, p < 0.0001. Data are shown as mean ± SEM. *p < 0.05, **p < 0.01, ***p < 0.001. Source data are provided as a Source Data file.

