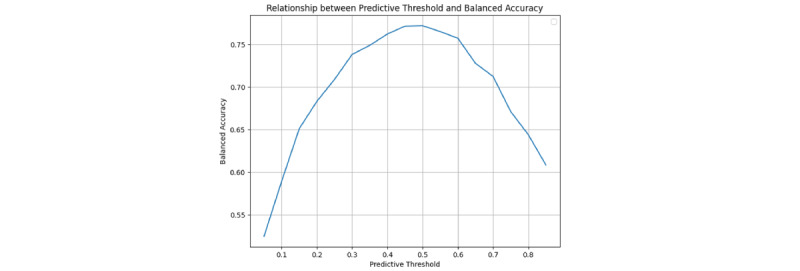
Figure 6.

Plot showing a relationship between predictive threshold for the model and balanced accuracy associated with treatment based on model prediction. The y-axis is balanced accuracy and the x-axis represents the threshold of prediction. All values were computed using leave-one-out cross-validation and estimated costs from the other cost analysis.
