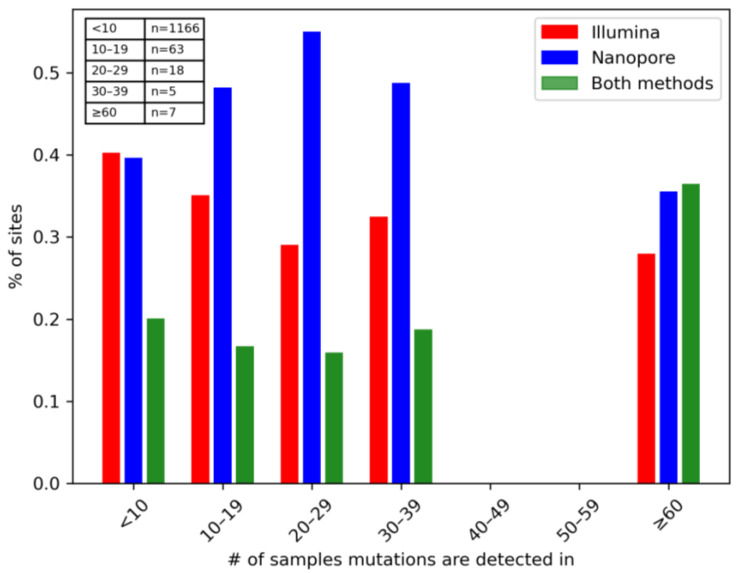
Figure 3.
Comparison of mutation detection between sequencing tools based on frequency. Mutations were binned based on the total number of samples each was detected in, with the number of mutations in each group reported in the attached table. Percentage of sites (y-axis) refers to the fraction of the sum of the number of samples detecting each mutation in that particular bin. Red and blue bars represent sites exclusively detected by Illumina and Nanopore, respectively, while green bars represent common sites.

