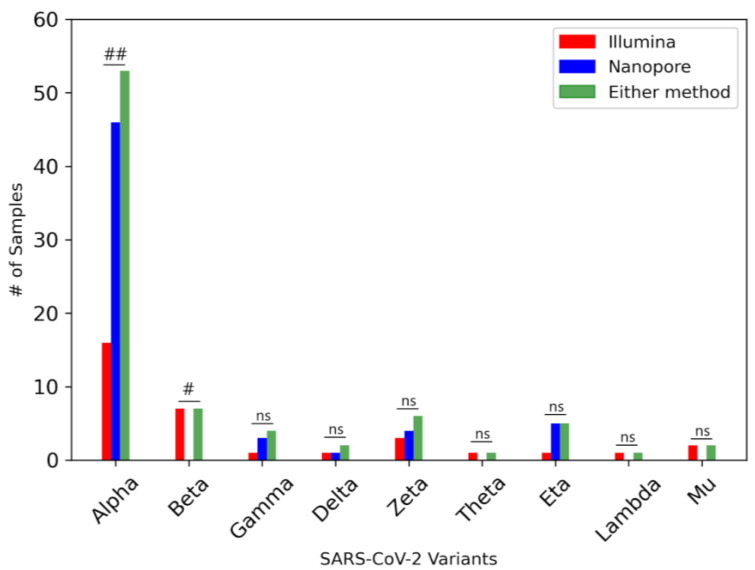
Figure 4.
Relative abundance of VOCs/VOIs in SARS-CoV-2 wastewater samples. Using a combination of Freyja and the detection of signature and marker mutations [8], the variants found within each sample were identified. Green bars indicate the number of samples containing each variant, as detected with either sequencing method, compared to variants detected only in the Illumina (red) or Nanopore (blue) dataset. Barnard’s exact test: ##: p < 0.01, #: p < 0.05, ns: p > 0.05.

