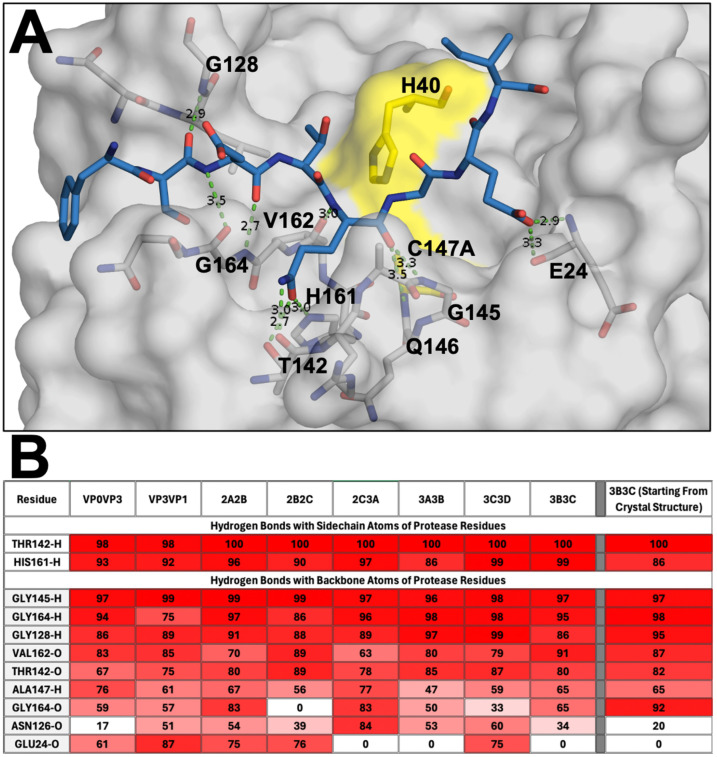
Figure 2.
Hydrogen bond network between the substrate peptides and the active site of EV68-3C protease. (A) The EV68-3C protease in grey surface representation, focusing on the active site pocket with the catalytic dyad highlighted in yellow, and the end point modeled 3C3D peptide (8 mer) post MD simulation shown in blue sticks. Hydrogen bonds between the protein and peptide heavy atoms are depicted with green dashed lines. (B) Percent frequency of the hydrogen bonds between EV68-3C protease and modeled substrate peptides, as well as the 3B3C peptide co-crystal structure (PDB ID: 9AX9), during MD simulation trajectories. The bonds present during the simulation with higher frequency interactions are denoted in darker red and lower frequency interactions are in white.

