Figure 5.
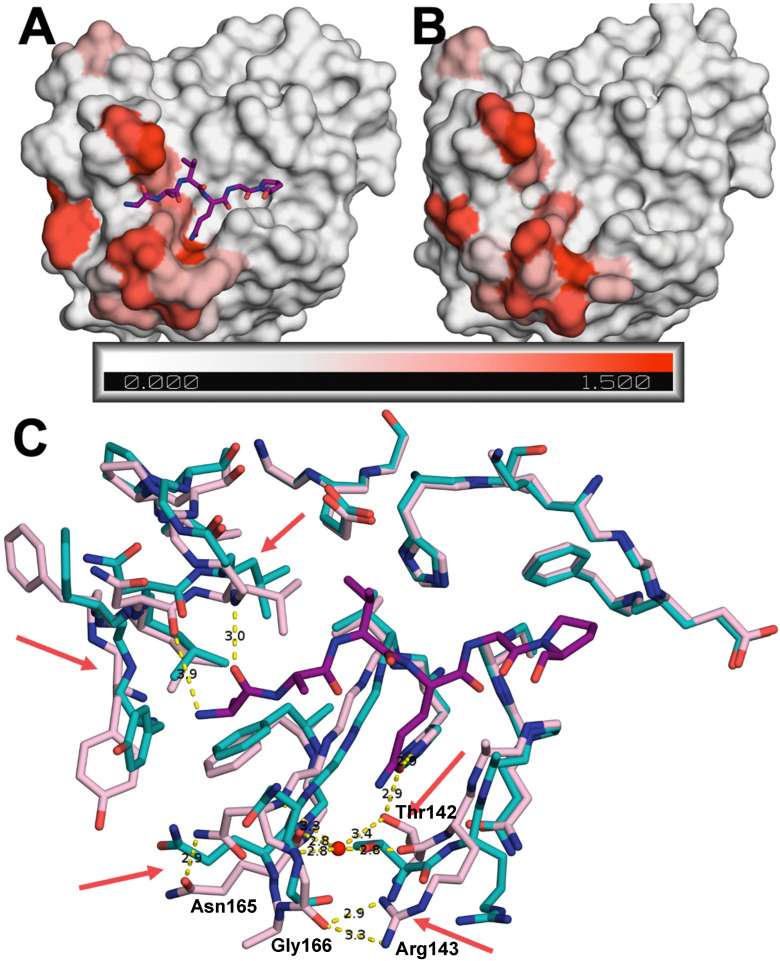
Comparison of peptide-bound and apo EV68-3V protease crystal structures. Surface representation of (A) 3B3C-peptide-bound (PDB ID: 9AX9) and (B) apo (PDB ID: 8FL5) protease colored according to variation of backbone, assessed by the average difference in distance between the C-alpha atoms of residues (in Å) between the two structures. (C) Superposition of the two structures in stick representation with red arrows pointing to the largest changes in key residues between the apo (cyan) and the substrate-bound (pink) co-crystal structures. The 3B3C peptide is depicted as purple sticks.

