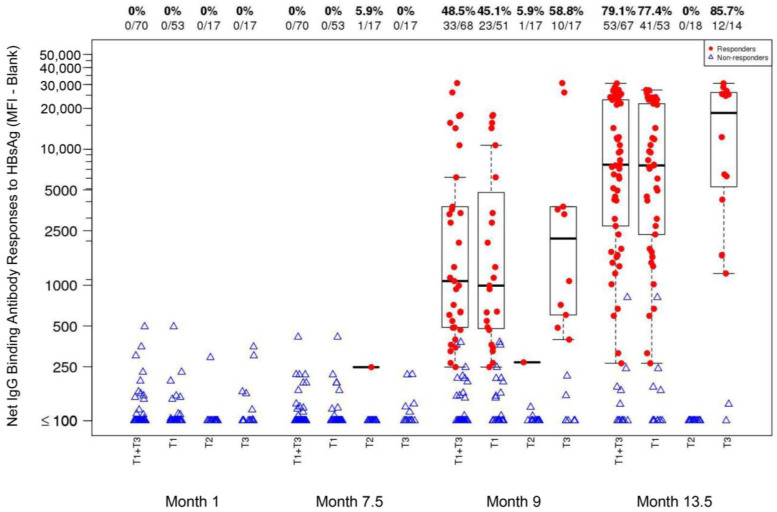
Figure 5.
Net IgG-binding antibody responses [mean fourescence intensity (MFI)-blank] to HBsAg (1:50 dilution) at Month 1 [1 month after TT vaccination; T1TT-HIV-HBV and T3TT-HBV], Month 7.5 [two weeks after the last ALVAC and AIDSVAX B/E vaccination; T1TT-HIV-HBV and T2HIV], Month 9 [2 weeks after the second HBV vaccination; T1TT-HIV-HBV and T3TT-HBV], and Month 13.5 [2 weeks after the third HBV vaccination; T1TT-HIV-HBV and T3TT-HBV] in the HVTN 097 participants, stratified by treatment assignment arm. At Month 0, T1TT-HIV-HBV and T3TT-HBV received TT; T2HIV received a placebo. At Months 7.5, 8.5, and 13, T1TT-HIV-HBV and T3TT-HBV received HBV; T2HIV received a placebo. Response rates and numbers of participants are shown at the top of the plot. Responders: red dot; non-responders: open blue triangle.

