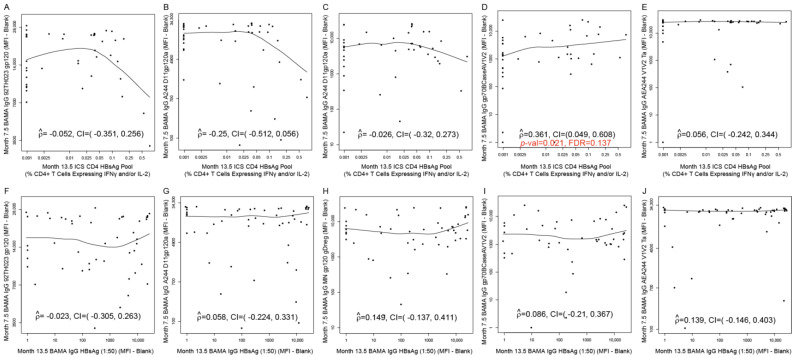
Figure 8.
Correlation plots for (A–E) Month 13.5 HBsAg-specific CD4+ T-cell responses versus Month 7.5 IgG-binding antibody responses against the HIV antigen designated on each y-axis; (F–J) Month 13.5 HBsAg-specific IgG-binding antibody responses versus Month 7.5 IgG-binding antibody responses against the HIV antigen designated on each y-axis. Data are shown for HVTN 097 participants [T1TT-HIV-HBV arm only]. ICS CD4 HBsAg pool: CD4+ T-cell responses (% CD4+ T cells expressing IFNγ and/or IL-2) to HBsAg pool; BAMA IgG HBsAg: Net IgG-binding antibody responses (MFI-blank) to HBsAg. Each dot represents one participant. At Month 13, T1TT-HIV-HBV participants received HBV. At Month 7, T1TT-HIV-HBV received the last dose of ALVAC and AIDSVAX B/E. For the correlation with FDR ≤ 0.2, the p-value and FDR value are shown in red font (panel D). For all other panels, the correlation was not significant (FDR > 0.2).

