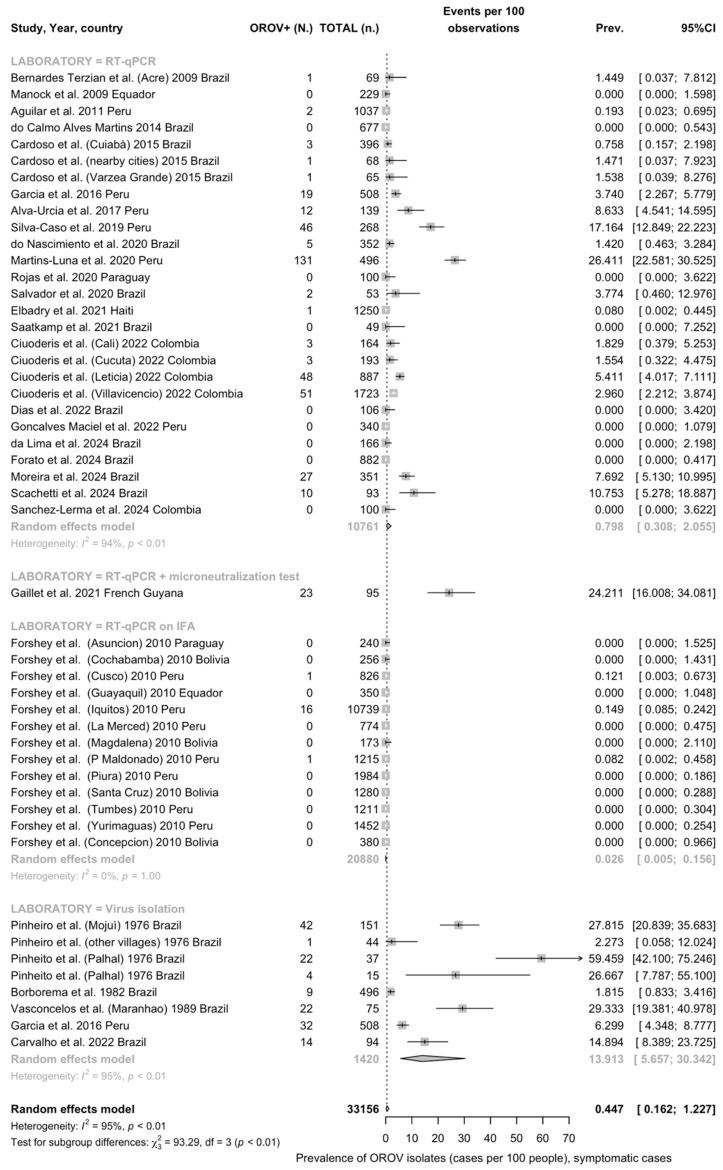
Figure A3.
Forest plot on studies reporting on Oropouche Virus (OROV) isolates either through viral identification or real-time (quantitative) polymerase chain reaction (RT-qPCR) among symptomatic individuals (note: 95%CI = 95% confidence interval; IFA = indirect immunofluorescence assay) [10,11,12,14,16,17,20,23,24,25,33,35,40,41,42,48,61,62,63,64,65,66,67,68,69,70,71,72,73,74,75,76,77,78,79,80,81,82,83,84,85,86,87,88,89,90,91].

