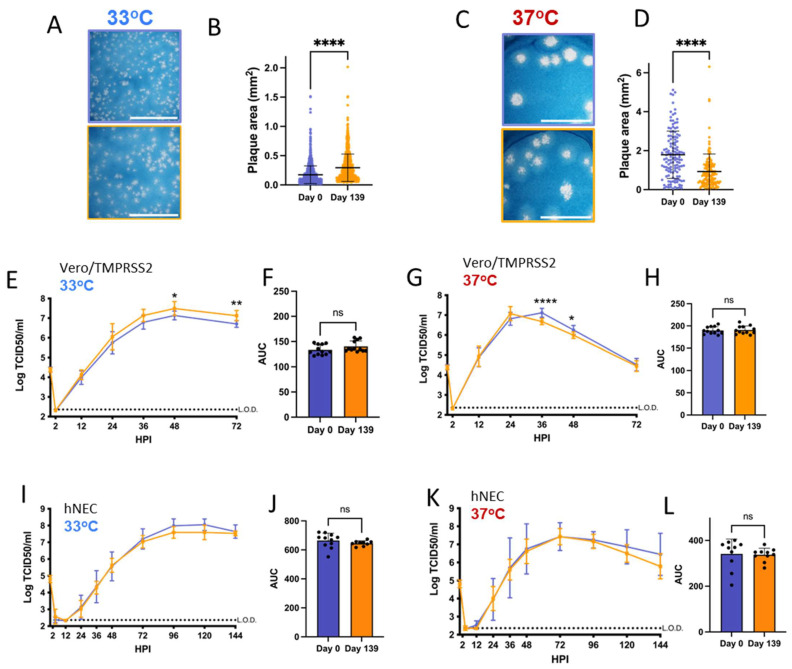
Figure 5.
Virus isolated from Patient 3 later during the infection has distinct temperature-dependent plaque phenotypes but no significant replication differences. p values displayed as “ns” p > 0.05, * p < 0.05, ** p < 0.01 and **** p < 0.0001. (A,C): representative images of plaques in Vero/TMPRSS2 cells from each virus isolate at 33 °C and 37 °C, respectively, scale bar = 10 mm. (B,D): Quantified plaque sizes for >889 (33°) and 129 (37 °C) plaques per virus accumulated from 3 independent experiments on Vero/TMPRSS2 cells, unpaired t-test. (E,G): Growth curves showing virus replication on Vero/TMPRSS2 cells at 33 °C and 37 °C, respectively, 3 independent experiments with four wells per virus per experiment, standard deviation shown on error bars, and two-way repeated measures ANOVA with Bonferroni’s multiple comparisons test. (F,H): Total virus production on Vero/TMPRSS2 cells measured until peak tire at 33 °C (48 HPI peak) and 37 °C (36 HPI peak), respectively, unpaired t-test. (I,K): Growth curves on hNECs at 33 °C and 37 °C, respectively, 3 independent experiments, standard deviation shown on error bars, two-way repeated measures ANOVA with Bonferroni's multiple comparisons test. (J,L): Total virus production on hNECs measured until peak tire at 33 °C (120 HPI peak) and 37 °C (72 HPI peak), respectively, unpaired t test.

