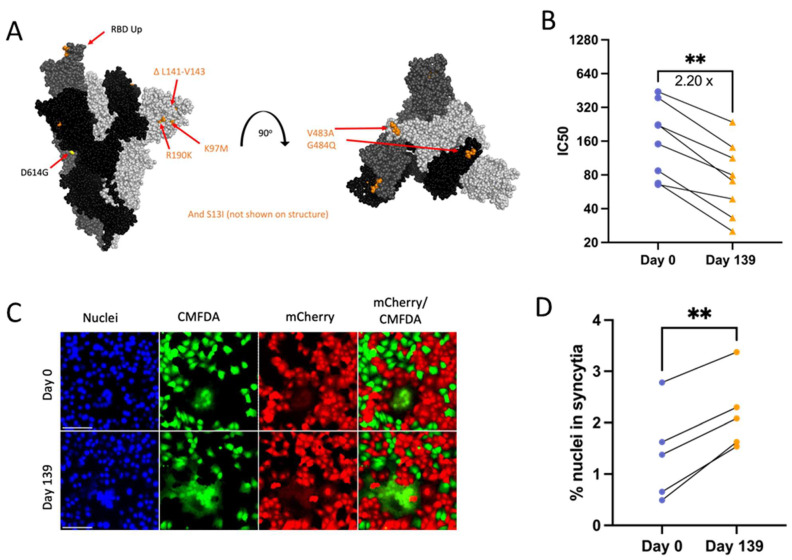
Figure 6.
Patient 3 Day 139 virus shows significant escape from neutralizing antibodies (B) and increased Spike-induced syncytia formation (D). p values displayed as ** p < 0.01. (A): Side and top view of the Spike trimer (each monomer in a different shade of grey, one RBD in up conformation), with Day 139 mutations displayed (no additional mutations apart from D614G on Day 0 Spike) (PyMOL, PDB: 7WZ2). (B): PRNT IC50 values for Patient 3 viruses using 8 convalescent serum samples (each tested in duplicate) and graphed individually with lines connecting serum from the same individual. Fold change calculated from geometric means, paired 2-tailed t-test. (C): Example image of syncytia formation induced by the Patient 3 CHLA virus pCAGGS-Spike plasmids versus a no plasmid control. Notably, the Day 0 plasmid is the same as in Patient 2. Scale bar = 100 µm. (D): Percentage of nuclei within syncytia, 5 independent experiments graphed separately. Statistics were performed on data pooled from all 5 experiments, paired 2-tailed t-test, ** p < 0.01.

