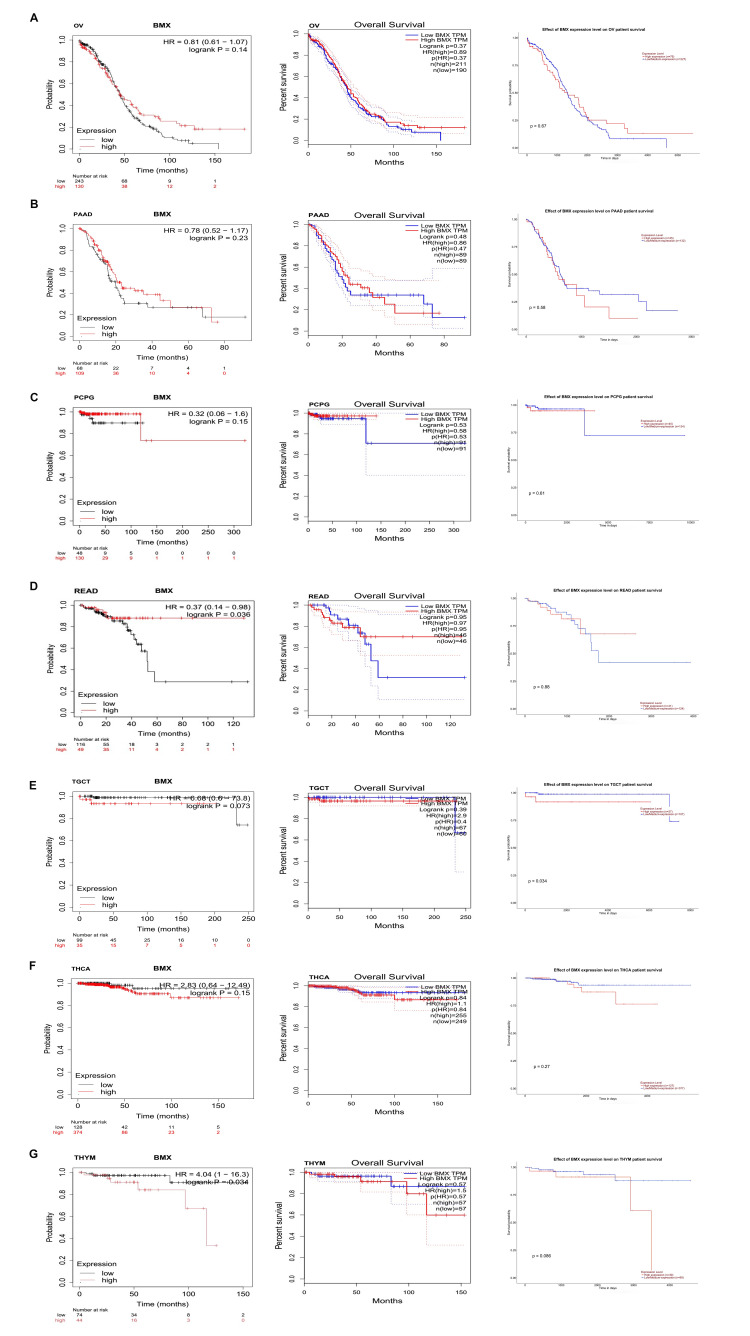
Figure 18. The correlation between the BMX expression level and the survival outcome of patients using Kaplan-Meier plotter, GEPIA, and UALCAN databases.
The relationship between BMX expression and the overall survival of patients with (A) OV, (B) PAAD, (C) PCPG, (D) READ, (E) TGCT, (F) THCA, and (G) THYM from Kaplan-Meier Plotter, GEPIA, and UACLAN respectively.
BMX: bone marrow kinase; GEPIA: Gene Expression Profiling Interactive Analysis; UALCAN: University of Alabama at Birmingham Cancer Data Analysis Portal; OV: ovarian serous cystadenocarcinoma; PAAD: pancreatic adenocarcinoma; PCPG: pheochromocytoma and paraganglioma; READ: rectum adenocarcinoma; TGCT: testicular germ cell tumors; THCA: thyroid carcinoma; THYM: thymoma; HR: hazard ratio; log-rank p: p-value resulting from log-rank test; p: p-value; n: number of samples; TPM: Transcripts per million.

