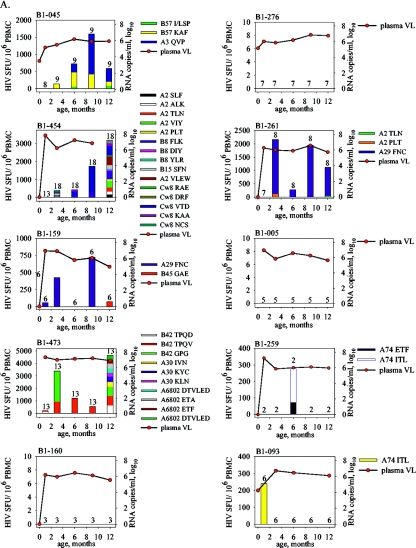
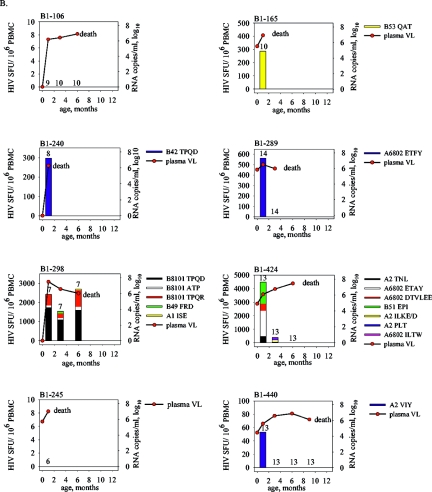
FIG. 2.
Spectrum of HIV-1-specific peptide responses in HIV-1-infected infants with measurements at every time point to 1 year (A) or death (B). Individual graphs present HIV-1-specific SFU/106 PBMC (stacked colored bars) and HIV-1 RNA copies/ml plasma (closed circles) as functions of age. The numbers above each bar or above the horizontal axes indicate the numbers of peptides tested at each time point, while the heights of each of the colored sections of the bars indicate the strengths of the peptide-specific responses. The number of peptides was the lowest at month 1, due to limitations in cell numbers, and remained constant from month 3 to 1 year or death. The notation of death indicates the infant died 1 to 3 months after the last measurement.


