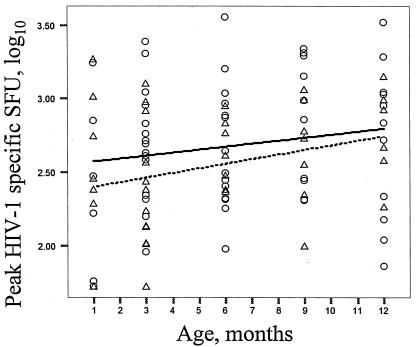
FIG. 3.
HIV-1-specific IFN-γ responses increase with age in HIV-1-infected infants. Individual peak HIV-1 SFU responses are plotted on the y axis with respect to age of the infant, which is plotted on the x axis. Infants infected with HIV-1 in utero are represented by triangles; those infected peripartum are represented by circles. The linear mixed-effect regression lines are shown for changes in peak HIV-1 SFU numbers over time for infants infected in utero(dotted) and peripartum (solid) and are not significantly different from each other.

