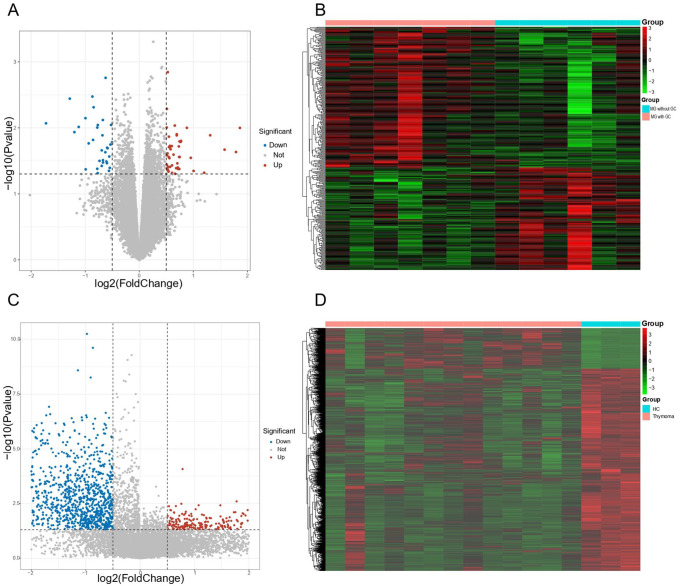
Figure 1.
Identification of the DEGs. (A) Volcano plot for MG. DEGs between MG patients with ectopic germinal centers in the thymus and without ectopic germinal centers. The red dots represented upregulated DEGs and the blue dots represented downregulated DEGs. (B) Heatmap for MG. (C) Volcano plot for thymoma (P-value < .05 and|log2FC| > 0.25). (D) Heatmap for thymoma. DEGs indicate differentially expressed genes; MG, myasthenia gravis.

