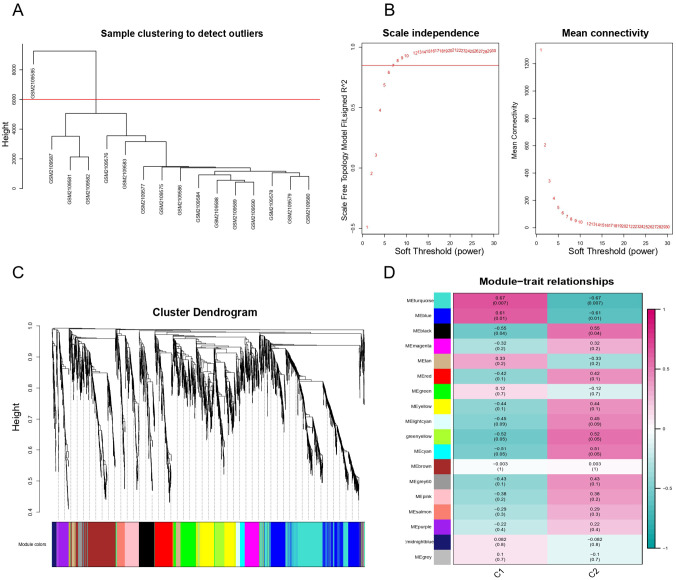
Figure 3.
WGCNA result overview. (A) Sample clustering. Delete one sample outlier. (B) Soft threshold screening plot. The soft power of β = 7 was selected as the soft threshold for subsequent analyses. (C) Hierarchical clustering tree. The upper part of this figure represents the clustering of genes. The lower part represents the gene modules, which make up 18 modules. Gray represents genes that have not been classified into modules. (D) Heatmap of the correlation between the module eigengenes and clinical traits of MG. Each row represents a different gene module, and each column is a representative trait. C1 represents normal tissue and C2 represents thymoma. The value in the box represents the correlation and the P-value. Pink represents positive correlation, and green represents negative correlation. DEGs indicate differentially expressed genes; GO, Gene Ontology; MG indicates myasthenia gravis; WGCNA, weighted gene co-expression network analysis.

