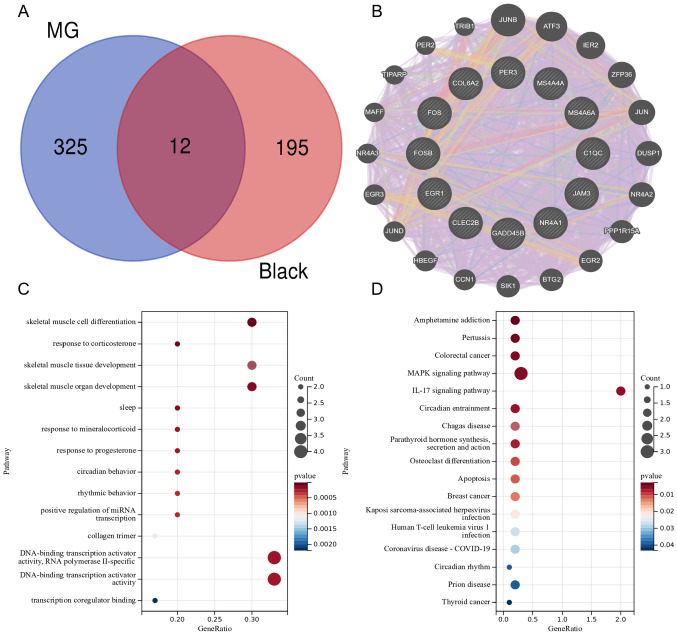
Figure 4.
Gene–gene interaction network and Enrichment Analysis of GO and KEGG Pathways of gene intersection. (A) Venn diagram showing the overlapping genes of the black module genes (most associated with thymoma) in WGCNA with DEGs in MG. (B) The network of 12 genes and their co-expression genes were constructed and analyzed by GeneMANIA. (C) The GO enrichment analyses of the candidate genes. (D) KEGG pathway analysis of the candidate genes. KEGG, Kyoto Encyclopedia of Genes; MG, myasthenia gravis; WGCNA, weighted gene co-expression network analysis.

