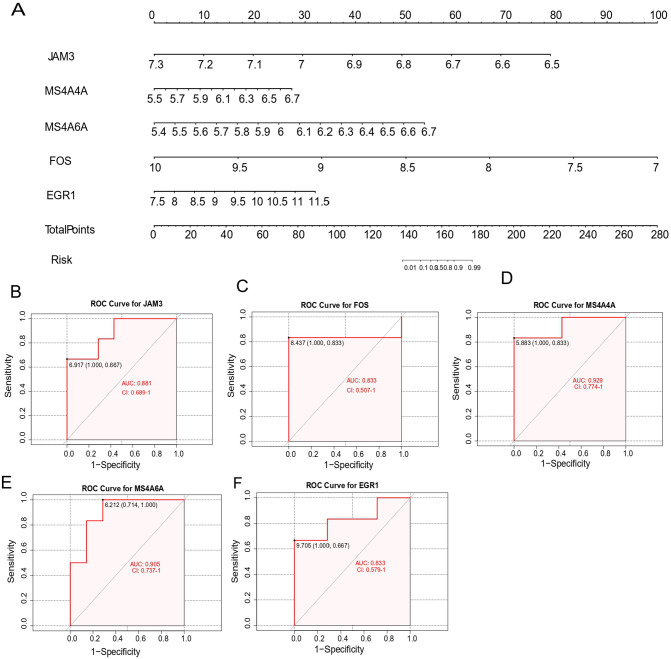
Figure 6.
Nomogram construction and the diagnostic value evaluation. (A) The visible nomogram for diagnosing MG with thymoma. (B to F) The ROC curve of each candidate gene (JAM3, FOS, MS4A4A, MS4A6A, and EGR1) shows the significant thymoma–MG diagnostic value. AUC indicates area under the curve; EGR1, early growth response 1; FOS, Proto-Oncogene C-Fos; JAM3, junctional adhesion molecule 3; MG, myasthenia gravis; MS4A4A, membrane-spanning 4 Domains subfamily A member 4A; MS4A6A, membrane-spanning 4 Domains subfamily A member 6A.

