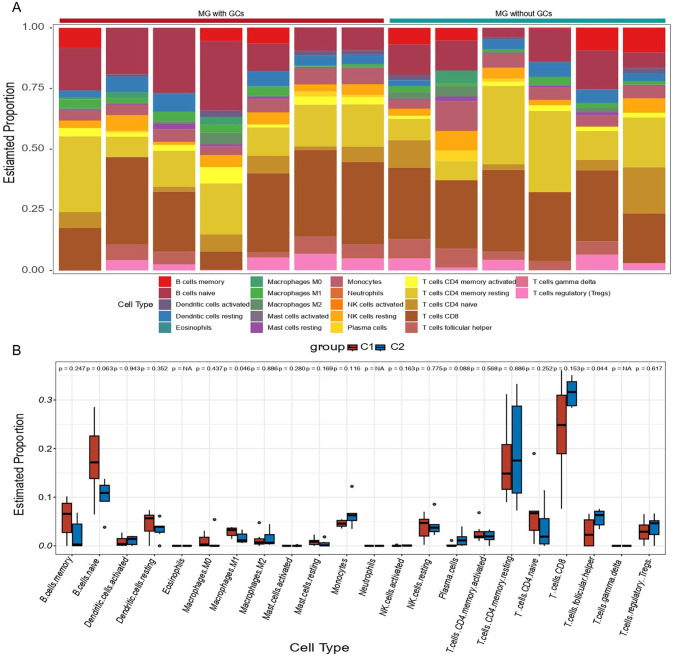
Figure 7.
Immune infiltration analysis in MG. (A) Bar plot for the relative abundance of 22 immune cell types in each sample. (B) Infiltration differences of immune cells in C1 and C2. C1 represents MG patients with ectopic germinal centers and C2 represents MG patients without ectopic germinal centers. MG indicates myasthenia gravis.

