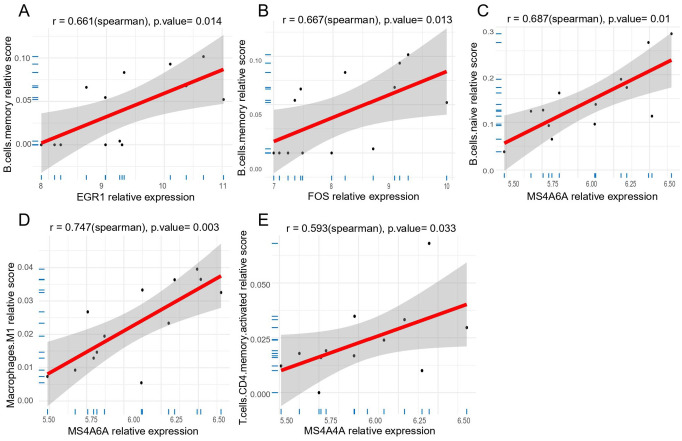
Figure 8.
Correlation between five key genes and specific immune cells in MG. (A) The correlation between EGR1 and memory B cells. (B) The correlation between FOS and memory B cells. (C) The correlation between MS4A6A and naive B cells. (D) The correlation between MS4A6A and M1 macrophages. (E) The correlation between MS4A4A and memory CD4T cells. EGR1 indicates early growth response 1; FOS, Proto-Oncogene C-Fos; MG, myasthenia gravis; MS4A4A, membrane-spanning 4 Domains subfamily A member 4A; MS4A6A, membrane-spanning 4 Domains subfamily A member 6A.

