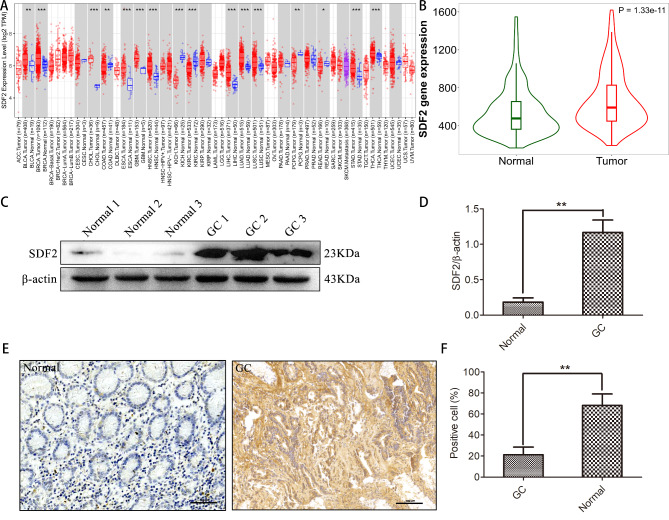
Fig. 1.
SDF2 is high expression in GC tissues. (A) The expression level of SDF2 in different kinds cancers and normal tissue samples in TIMER database (STAD: stomach adenocarcinoma, CHOL: cholangio carcinoma, LIHC: liver hepatocellular carcinoma, COAD: colon adenocarcinoma, KIRC: Kidney renal clear cell carcinoma, READ: rectum adenocarcinoma, ACC: adrenocortical carcinoma, BLCA: bladder urothelial carcinoma, BRCA: breast cancer, CESC: cervical squamous cell carcinoma, ESCA: esophageal carcinoma, GBM: glioblastoma multiforme, HNSC: head and neck squamous cell carcinoma, KICH: kidney chromophobe, KIRP: kidney renal papillary cell carcinoma, KIRC: kidney renal clear cell carcinoma, LAML: acute myeloid leukemia, LUAD: lung adenocarcinoma, LUSC: lung squamous cell carcinoma, PAAD: pancreatic adenocarcinoma, PCPG: pheochromocytoma and paraganglioma, PRAD: prostate adenocarcinoma, SARC: sarcoma, SKCM: skin cutaneous melanoma, TGCT: testicular germ cell tumors, THCA: thyroid carcinoma, THYM: thymoma, UCEC: uterine corpus endometrial carcinoma, UVM: uveal melanoma). (B) The expression level of SDF2 in GC tissue samples is significantly higher compared with normal gastric tissue samples in the database (t test was used to compare the two groups). (C) The expression of SDF2 was determined by western blotting assay. (D) SDF2 protein expression levels in GC tissues were higher compared with normal tissues by western blotting (n = 15). **P˂0.01 compared with the normal group. (E) SDF2 immunohistochemical staining in clinical normal gastric tissue and GC tissues samples (bar = 100 μm). (F) Statistical analysis showed that SDF2 expression in GC tissues were higher than that in normal gastric tissues by immunohistochemical staining (n = 10). **P˂0.01 compared with the normal group

