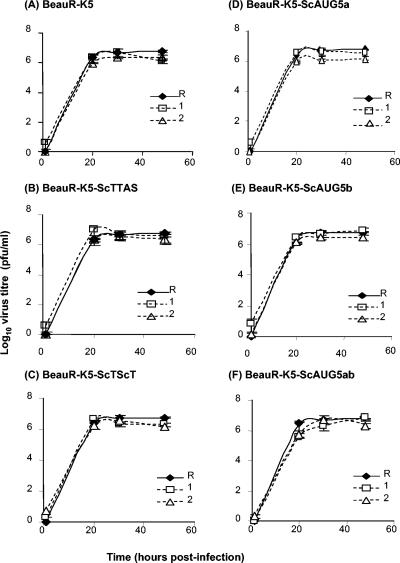
FIG. 6.
Comparison of the in vitro growth kinetics of the gene 5 rIBVs in CK cells. Two independent rIBVs with each modification were used. CK cells were infected with 5.4 × 10⁴ PFU (MOI ≈ 0.03) of Beau-R or of each rIBV, and the titer of progeny virus was analyzed by plaque titration assay on CK cells over a period of 48 h. Panels show a comparison of the growth kinetics of each analogous pair (1 [dashed lines with open square] and 2 [dashed lines with triangle]) of the rIBVs with Beau-R (solid line and filled diamond). (A) BeauR-K5, (B) BeauR-K5-ScTTAS, (C) BeauR-K5-ScTScT, (D) BeauR-K5-ScAUG5a, (E) BeauR-K5-ScAUG5b, and (F) BeauR-K5-ScAUG5ab. The error bars represent standard deviations.

