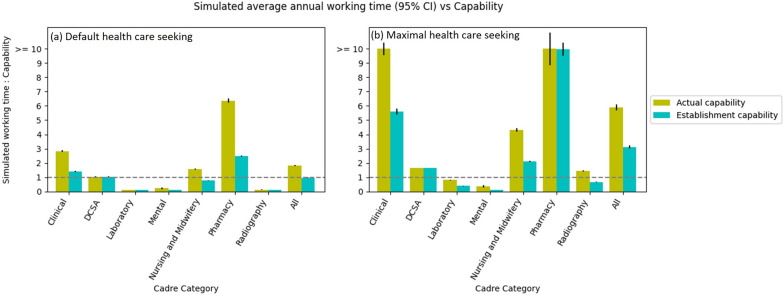
Fig. 6.
Comparison of simulated average annual working time and actual/establishment capabilities per cadre category in two health care seeking scenarios. The annual working time is the annual number of appointments times the appointment time requirements. The line of “simulated working time: capability” = 1 means the usage of healthcare workers’ patient facing time in the model perfectly matches their capabilities. Note that since the data for the ConWithDCSA appointment time requirement are not available, in the simulation, it is assumed such a value (i.e. 20 minutes for DCSA per appointment) that the simulated total working time can well match the Actual capabilities of DCSA; and that the extra capabilities of Laboratory and Radiography cadres may be due to that cancer modules in TLO Model have not fully represented the HSIs of laboratory and radiography services such as diagnostic test and screening on one hand and that the laboratory and radiography appointment time requirements might have been underestimated in data source on the other hand. Also note that Nutrition and Dental cadres are not analysed because of no relevant service data

