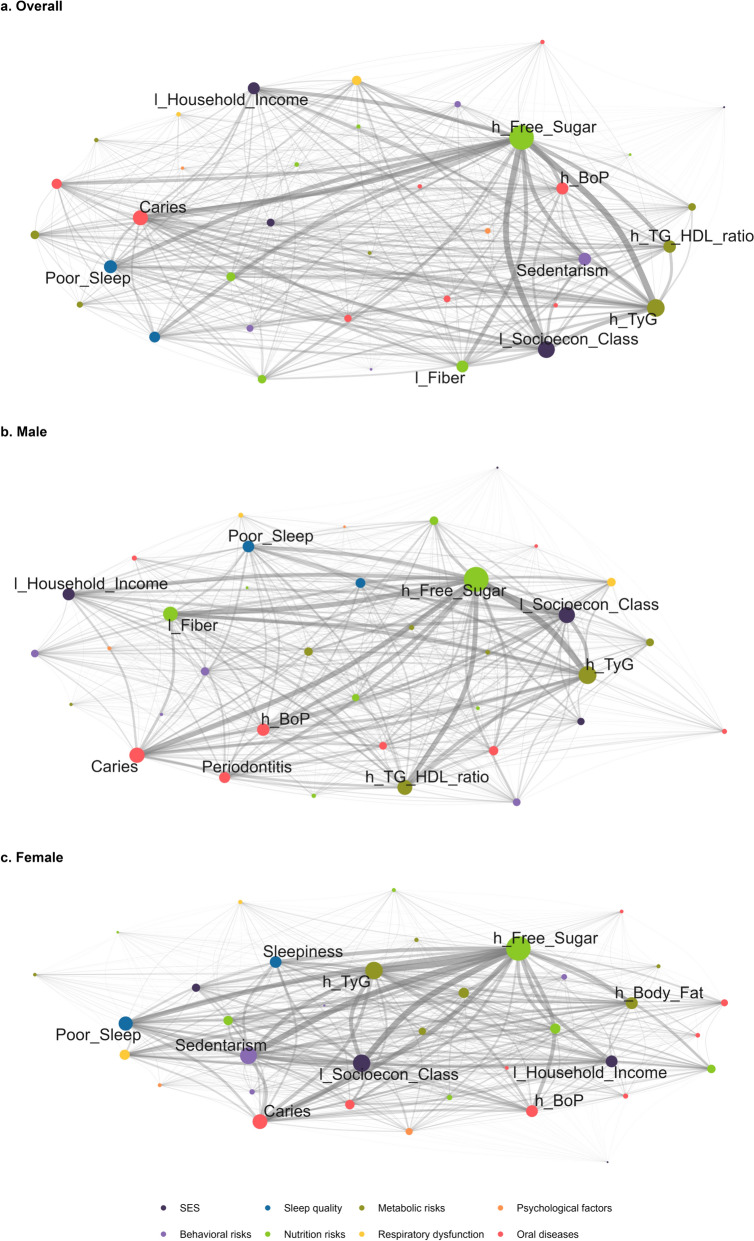
Fig. 1.
Complex networks of non-communicable diseases and risks by sex. RPS São Luís (N = 2515). The edges represent the co-occurrences between any two conditions, with thicker edges indicating a higher number of connections. The size of each node reflects its degree, meaning the number of connections it has with other nodes. Larger nodes indicate greater centrality. The figure with all the nodes identified can be found in the Additional file (Fig. S1). l_: Low; h_: High; PWV: pulse wave velocity; BoP: Gingival bleeding on probing

