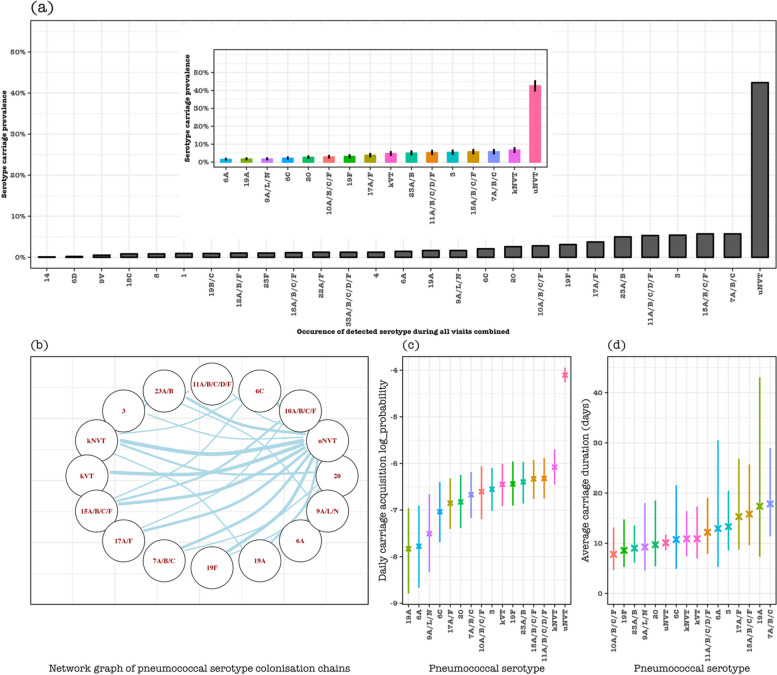
Fig. 3.
Pneumococcal serotype-specific carriage dynamics in considered serotypes with relative high sampling frequency. a Prevalence of each serotype in all samples, with ‘uNVT’ representing unknown non-PCV13 serotypes because they were not included in the serotyping assay which could only identify up to 23 serotypes including all VT. Insert in a is the carriage prevalence of each serotype or serogroup with a relatively high sample frequency, where ‘kVT’ represents known PCV13 serotypes with very low sample frequency (1, 4, 9 V, 14, 18C, and 23F), and ‘kNVT’ represents non-PCV13 serotypes with known serotypes with very low sample frequency (22A/F, serogroup 33 and 18, 12A/B/F, 19B/C, 8, and 6D). b Network diagram showing the acquisition of a serotype replacing a specific serotype in a colonisation chain. The size of the edges reflects the pairs of serotype transition events in the colonisation chain that occur more likely than expected, and the node represents the serotype or serotype group or vaccine-serotype group. c Daily pneumococcal carriage acquisition probability under a log scale and d daily average pneumococcal serotype carriage duration

