Fig. 1.
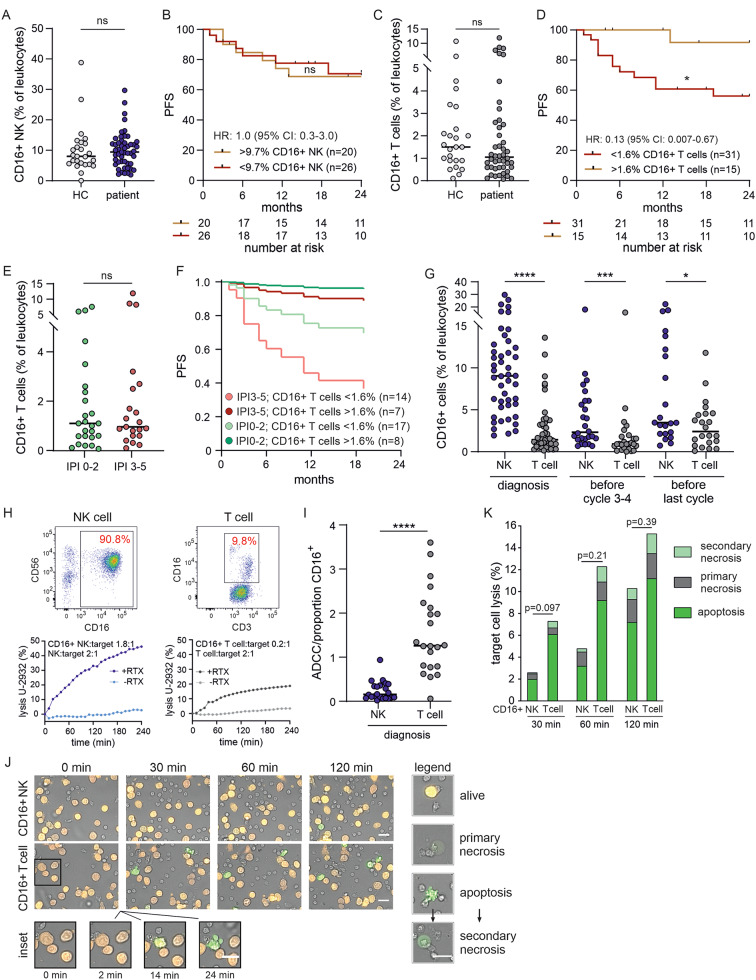
A high percentage of CD16+ T cells positively predicts patient outcome. A) Percentages of CD16+ NK in aggressive B-NHL patients (patient, n = 46) at diagnosis compared to healthy controls (HC, n = 25). B) Kaplan-Meier survival curve over 24 months. Progression-free survival (PFS) for high (> 9.7%) and low (< 9.7%) percentages of CD16+ NK cells at diagnosis. C) Percentages of CD16+ T cells in aggressive B-NHL patients at diagnosis (patient, n = 46) compared to healthy controls (HC, n = 25). D) Kaplan-Meier survival curve over 24 months. PFS for high (> 1.6%) and low (< 1.6%) percentages of CD16+ T cells at diagnosis. E) Percentages of CD16+ T cells at diagnosis according to patient’s IPI (IPI 0–2, n = 25; IPI 3–5, n = 21). F) Cox proportional hazard analysis of high (> 1.6%) and low (< 1.6%) percentages of CD16+ T cells at diagnosis in relation to IPI over 24 months. G) Percentages of CD16+ T cells and CD16+ NK cells at diagnosis and during therapy, (the number of patients (n) for each population (in the order given on the x-axes) n = 46, 46, 26, 26, 22, 22). H) Representative lysis capacity of NK and T cell populations (below) of one patient concerning their respective percentages of CD16+ cells (above). NK and T cells were isolated and lysis capacity was measured using a population-based real-time killing assay. The shown effector to target cell ratio (E: T) is 2:1. Percentages of CD16+ cells within the NK and T cell populations were quantified by flow cytometry. I) Quantification of antibody-dependent cytotoxicity (ADCC) in relation to the percentage of CD16+ NK (NK, n = 22) or CD16+ T cells (T cell, n = 22) within the whole NK or CD3 + T cell population. ADCC capacity corresponds to the difference between the lysis of target cells with rituximab (+ RTX) and without rituximab (-RTX). J) Representative images of rituximab-dependent ADCC by sorted CD16+ NK and CD16+ T cells at single cell level against TMD8 pCasper cells. Scale bars are 20 μm. K) Quantification of ADCC of sorted cells from four patients at different stages of therapy. HR hazard ratio; CI confidence interval; In Kaplan-Meier survival curves black marks represent censored patients; ns non-significant; * p < 0.05; *** p < 0.001; **** p < 0.0001

