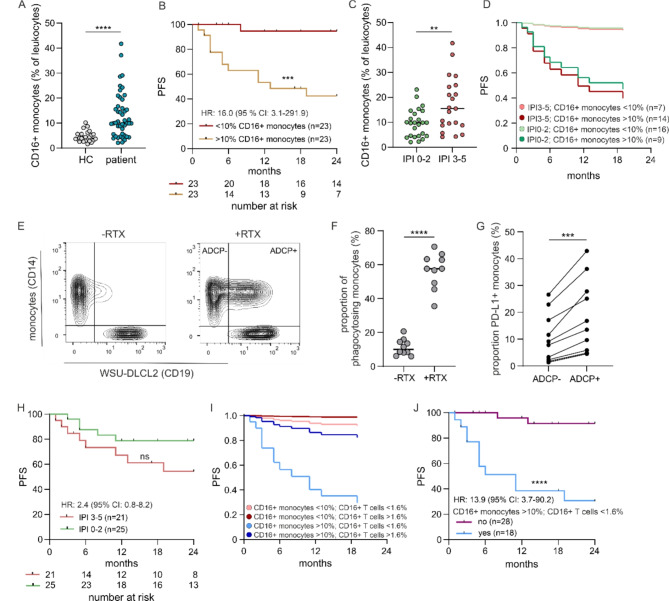
Fig. 2.
A high percentage of CD16+ monocytes negatively predicts patient outcome. A) Percentage of CD16+ monocytes (CD14 + + CD16+ (intermediate monocytes) or CD14 + CD16++ (nonclassical monocytes)) in aggressive B-NHL patients (patient, n = 46) at diagnosis compared to healthy controls (HC, n = 25). B) Kaplan-Meier survival curve over 24 months. Progression-free survival (PFS) for high (> 10%) and low (< 10%) percentages of CD16+ monocytes at diagnosis. C) Percentage of CD16+ monocytes at diagnosis according to patient’s IPI. (IPI 0–2, n = 25; IPI 3–5, n = 21). D) Cox proportional hazard analysis of high (> 10%) and low (< 10%) percentages of CD16+ monocytes at diagnosis in relation to IPI over 24 months. E) Representative staining of monocyte phagocytosis isolated from PBMC of a healthy donor. Monocytes were stained with anti-CD14 antibody and the target cell line WSU-DLCL2 with anti-CD19 antibody, co-cultured for 6 h without rituximab (-RTX) or with rituximab (+ RTX) and analyzed by flow cytometry. F) Percentage of monocytes that phagocytosed WSU-DLCL2 cells after co-culture of monocytes with WSU-DLCL2 cells for 6 h with (+ RTX) or without rituximab (-RTX); n = 10. G) Percentage of PD-L1+ monocytes after phagocytosis of WSU-DLCL2 cells (ADCP+) and monocytes without phagocytosing WSU-DLCL2 cells (ADCP-); n = 10. H) Kaplan-Meier survival curve over 24 months. PFS for patients with an IPI 0–2 or an IPI 3–5. I) Cox proportional hazard analysis of high (> 10%) and low (< 10%) percentages of CD16+ monocytes at diagnosis adjusted for high (> 1.6%) and low (< 1.6%) percentages of CD16+ T cells at diagnosis. CD16+ monocytes < 10%, CD16+ T cells < 1.6% (n = 13); CD16+ monocytes < 10%, CD16+ T cells > 1.6% (n = 10); CD16+ monocytes > 10%, CD16+ T cells < 1.6% (n = 18); CD16+ monocytes > 10%, CD16+ T cells > 1.6% (n = 5). J) Kaplan-Meier survival curve over 24 months. PFS for patients with a high percentage of CD16+ monocytes (> 10%) in combination with a low percentage of CD16+ T cells (< 1.6%) at diagnosis (light blue, yes) compared to patients without this combination (purple, no). In Kaplan-Meier survival curves, black marks represent censored patients. ns non-significant; ** p < 0.01; *** p < 0.001; **** p < 0.0001

