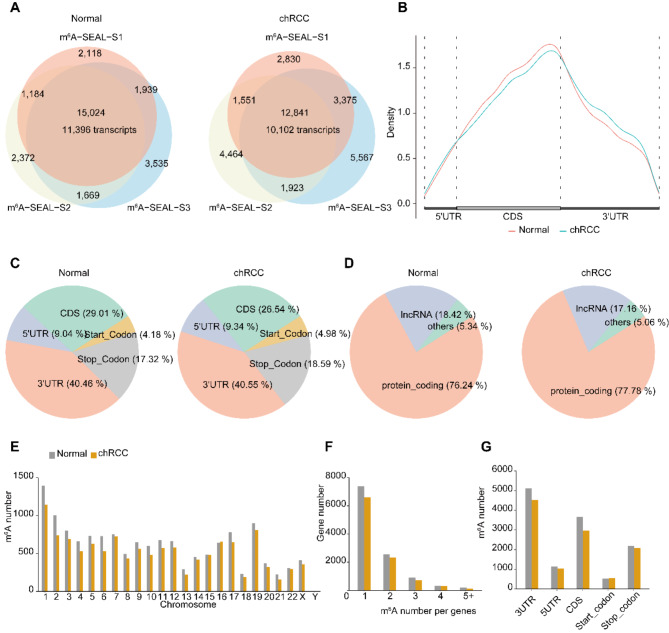
Fig. 2.
Characterization of m6 A modification in Normal and chRCC tissues reveals that decreased methylation number in chRCC Tissues. A, overlap of three biological replicates of m6A-SEAL-seq peaks identifying ~ 15,000 high-confident m6A peaks corresponding to 11,396 unique transcripts in normal tissues (left); Overlap of three biological replicates of m6A-seal peaks identifying ~ 12,800 high-confident m6A peaks corresponding to 10,102 unique transcripts in chRCC tissues (right). B, Metagene profile illustrating the region distribution of m6A peaks across the indicated mRNA segments. C, Pie chart depicting the fraction of the confident m6A peaks in each of the five non-overlapping transcript segments (5’UTR, start codon, coding sequence [CDS], stop codon and 3’UTR) in normal tissues (left); Pie chart depicting RNA types of m6A peaks in normal tissues (right). D, Pie chart presenting the fraction of the confident m6A peaks in eCRCC tissues (left); Pie chart depicting RNA types of m6A peaks in chRCC tissues (right). E, The number of m6A peaks in human chromosomes. F, The number of m6A peaks per gene. G, The number of m6A peaks in five non-overlapping transcript segments

