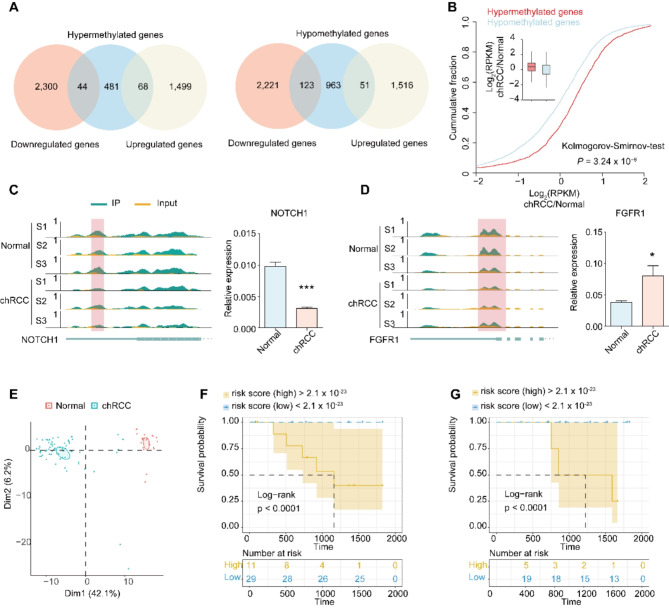
Fig. 5.
Conjoint analysis of m6A-SEAL-seq and RNA-seq data. A, Overlap of hypermethylation genes with up-regulation genes and down-regulation genes (left). Overlap of hypomethylation genes with up-regulation genes and down-regulation genes (right). B, Cumulative distribution displaying the expression level changes in mRNAs with hypermethylation or hypomethylation m6A modification. C-D, Integrative genomics viewer (IGV) tracks showing the indicated m6A-seal reads distribution on target transcripts and the relative expression level in Normal and chRCC tissues. (C) NOTCH1, (D) FGFR1. F-G Survival analyses in the training set (F) and testing set (G). Log-rank p < 0.0001 showed a significant survival difference between the two sub-groups

