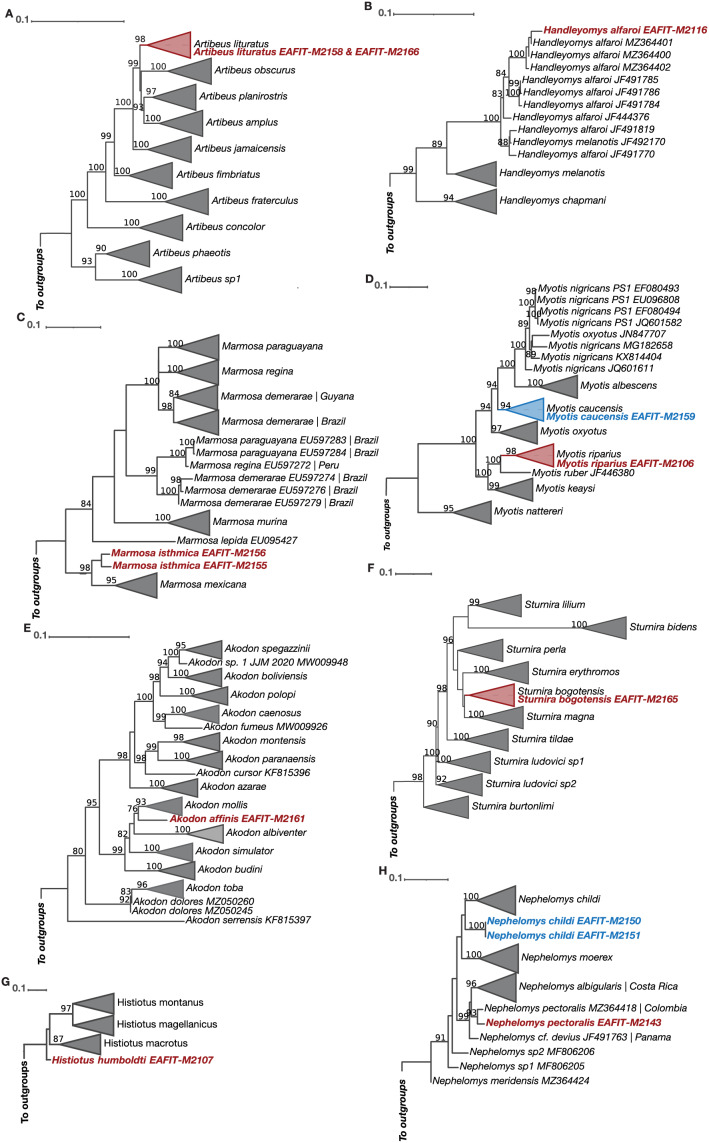
Figure 6. Maximum Likelihood reconstructions of the COI mitochondrial marker for all the genera represented in our taxon sampling.
(A) Artibeus, (B) Handleyomys, (C) Marmosa, (D) Myotis, (E) Akodon, (F) Sturnira, (G) Histiotus, (H) Nephelomys. Terminals of non-collapsed clades include GenBank accession numbers. Phylogenies that exhibit paraphyletic species show the corresponding localities of each sequence. Colored terminals correspond to our sequenced material. Bootstrap support values above 75% are shown above branches.

