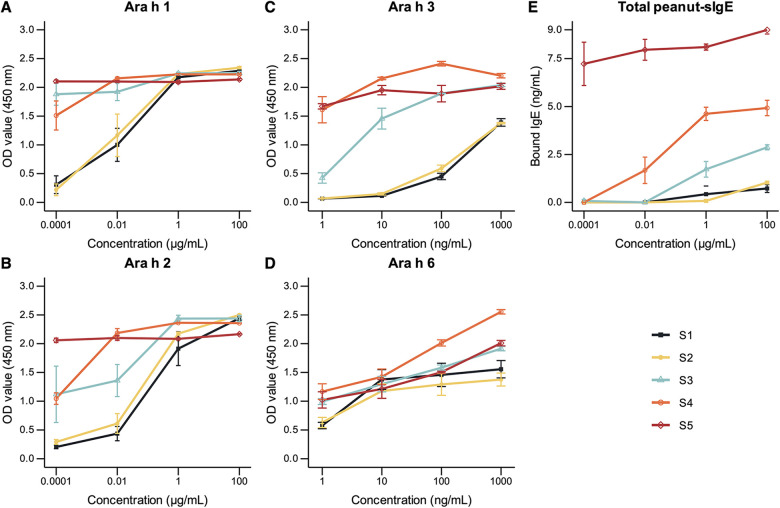
Figure 2.
(A–D) relative quantification of Ara h 1, Ara h 2, Ara h 3, and Ara h 6 in peanuts of developmental stages S1, S2, S3, S4, and S5 by ELISA using allergen-specific antibodies. Plates were coated with a maximum concentration of 100 µg/ml of each developmental stage (A,B). Plates were pre-coated with monoclonal antibody specific for Ara h 3 or Ara h 6, followed by the incubation of extracts of each developmental stage at a maximum concentration of 1,000 ng/ml (C,D). (E) Total peanut-specific IgE quantification by ELISA using a pooled serum of 4 highly allergic subjects. Plates were coated with a maximum concentration of 100 µg/ml of each developmental stage. Optical density (OD) values were measured at 450 nm and referenced at 570 nm. Peanut-specific IgE levels were converted to concentration values using a standard curve constructed using known concentrations of human recombinant IgE. Error bars represent standard errors (n = 3) or minimum–maximum for Ara h 3 and Ara h 6 ELISAs (n = 2).

