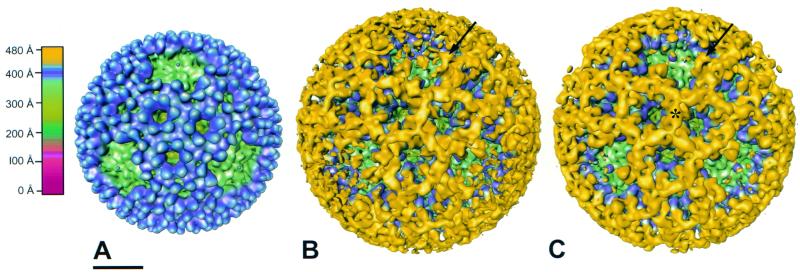
FIG. 4.
Surface-shaded representations of native T3D virions (A), T3D virions bound by 4F2 IgG (B), and T3D virions bound by 4F2 Fabs (C) viewed along an icosahedral threefold axis. The capsids are radially depth-cued as shown in the color chart. The same coloring scheme is used in other figures unless indicated otherwise. (A) Projections of ς3 (blue) protrude from the surface of the virion. A λ2 turret lies in a depression at each of the fivefold axes (green). (B) Mass density due to IgG bound to ς3 is shown in yellow. The IgG-bound virion structure has been radially cut at ∼480 Å to reveal only the Fab portion of the antibody. An arrow indicates a complete Fab. (C) Mass density due to Fabs bound to ς3 is shown in yellow. Fabs extend distally to a radius of ∼480 Å and form continuous tubes of density (∗) that surround the channels made by ς3. Entire Fabs are observed overhanging the fivefold axes (arrow). Scale bar, 200 Å.

