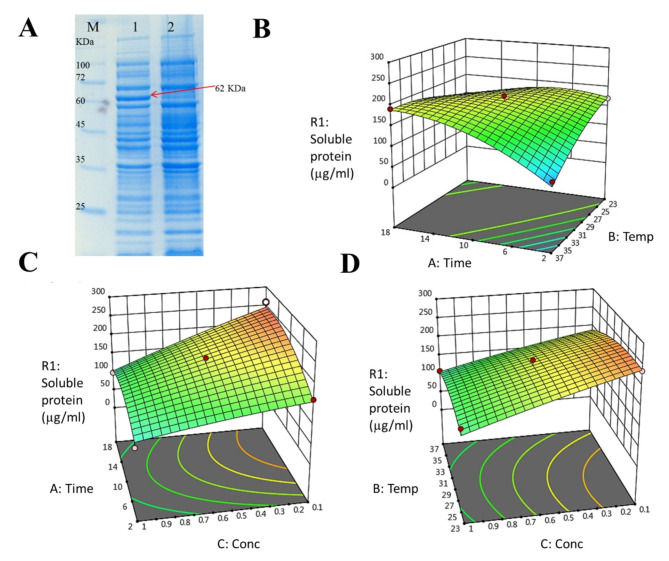
Fig. 1.
A SDS-PAGE analysis of total protein from transformed Escherichia coli BL21(DE3) with scFv-PE35KDEL-pTrc99a (lane 1) and E. coli non-transformed (lane 2) after induction with 1 mM IPTG at 37 ºC in LB medium for 3 h. M: protein marker (PM1500, SMOBIO). The arrow indicates the band of interest. B–D 3D response surface plot representing the interaction between two variables on the soluble expression of anti-HER2 immunotoxin (R1: response) in LB medium. B Interaction between post-induction time and post-induction temperature when IPTG concentration was 0.55 mM, C interaction between post-induction time and IPTG concentration when post-induction temperature was 30 ºC, and D interaction between post-induction temperature and IPTG concentration when post-induction time was 10 h

