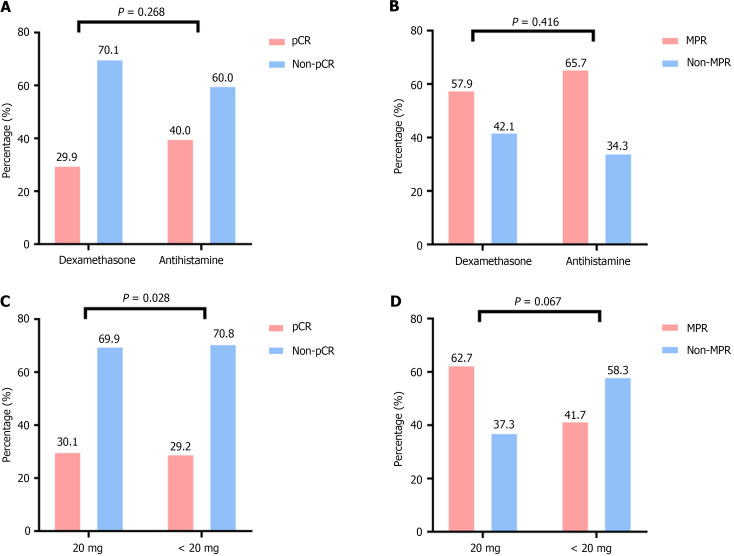
Figure 4.
Short-term efficacy assessment. A: Comparison of complete pathological response (pCR) between the dexamethasone and antihistamine groups. The P value is 0.268, indicating no statistically significant difference between the two groups; B: Comparison of major pathological response (MPR) between the dexamethasone and antihistamine groups. The P value is 0.416, indicating no statistically significant difference between the two groups; C: Comparison of pCR between the < 20 mg dexamethasone group and the 20 mg dexamethasone group. The P value is 0.928, indicating no statistically significant difference between the two dosage groups; D: Comparison of MPR between the < 20 mg dexamethasone group and the 20 mg dexamethasone group. The P value is 0.067, indicating no statistically significant difference between the two dosage groups. pCR: Complete pathological response; MPR: Major pathological response.

