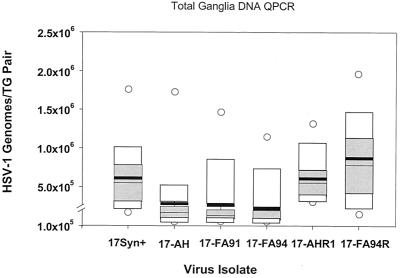
FIG. 4.
Box diagram of the total number of latent HSV-1 genomes present within each pair of mouse TG. Additional mice from the experiment shown in Fig. 3 were maintained for at least 30 days p.i. Total DNA was isolated from the TG and processed for QPCR detection of the viral genome as described previously (34). Each box diagram represents the compiled results from 14 animals (28 TG). The mean value obtained is shown as a heavy horizontal black bar and the 25th and 75th percentile values are indicated as gray boxes. White boxes indicate the 95th percentile values, and open circles indicate the maximum and minimum values.

