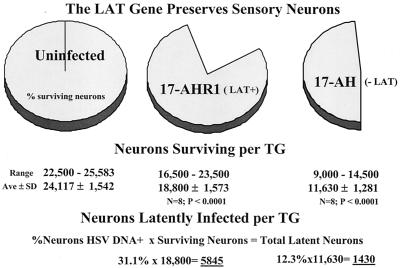
FIG. 5.
(Top) Pie charts demonstrating the percentage of sensory neurons remaining in the TG at 30 days p.i. (Middle) The range, mean (Ave), and standard deviation (SD) of the number of neurons per ganglia for 17-AHRI compared to uninfected and 17-AH compared to 17-AHRI (t test P values are shown). (Bottom) Total number of latently infected neurons per ganglion was calculated by multiplying the percentage of neurons positive for the viral genome by CXA-D (see text) by the number of neurons present in the ganglia at 30 days p.i.

