FIG. 7.
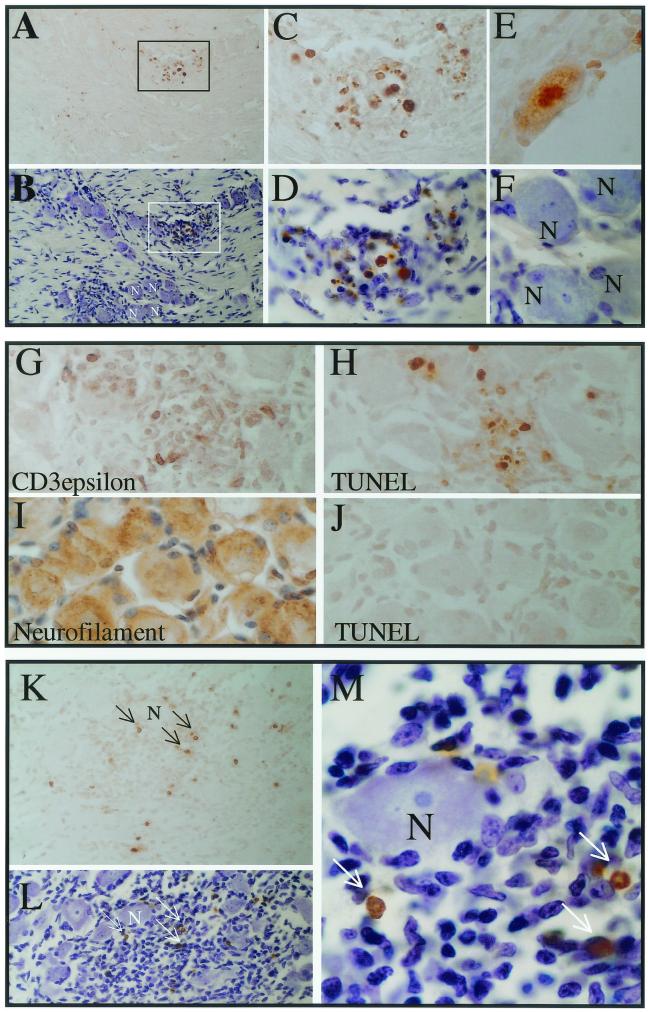
Detection of TUNEL-positive cells in infected TG. Mice were infected and processed for TUNEL staining as described in Materials and Methods. (A to F) Sections from 17-AH-infected ganglia at day 6 p.i. Panels A and B are at equal magnification; a region of TUNEL staining (boxed) is shown before (A) and after (B) counterstaining. Many neurons can be seen in panel B, some of which are labeled “N.” Panels C, D, E, and F are all at the same magnification. The boxed region is shown in panels C and D. Panel F shows the labeled neurons from panel B. Of the 1,875 neuronal profiles examined on day 6 p.i., none were TUNEL positive (Table 1). For comparative purposes, panel E shows a positive neuron from a ganglion infected with 17-AH at 10 days p.i. (G to J) Photomicrographs of sections from ganglia infected with 17-AH on day 6 p.i.; all are shown at the same magnification. Panel G was stained with antibody to CD3-ɛ, which labels T cells (positive cells are brown). A similar region of cellular infiltrate was stained for TUNEL in panel H (positive cells are brown). Panel I is a section stained with an antineurofilament antibody (positive cells are brown), and panel J is a similar region stained for TUNEL (no positive cells were seen). (K to M) Ganglia infected 10 days prior with 17syn+. Panels K and L are the same region at the same magnification following staining for TUNEL (brown, arrows) and subsequent counterstaining (blue). Many TUNEL-positive cells are evident (arrows) and many neurons can be seen in panel L (one is labeled “N”). This same region is shown at a greater magnification in panel N, with the same TUNEL-positive cells (brown) indicated by arrows.

