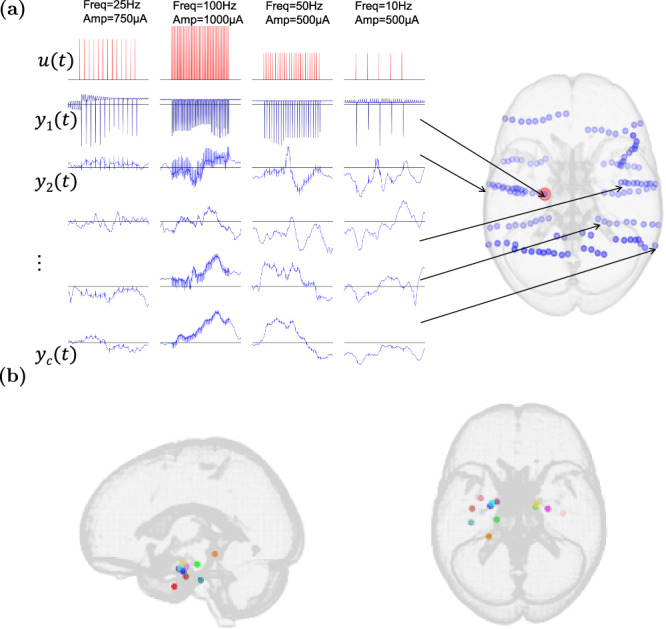
Fig. 1. Illustration of the iEEG data used in this work.

a Each cluster of adjacent blue circles corresponds to contacts on a single electrode (warped due to registration to standard space). u(t) encodes the applied stimulation pulse train, including both its frequency and amplitude. yk(t) refers to the recorded iEEG signal of the kth electrode ordered based on its closeness to the stimulation site. b Stimulation locations across the 13 subjects in this study, shown in standard MNI space. Only subjects with Medial Temporal Lobe (MTL) stimulation were selected (see Methods for details).
