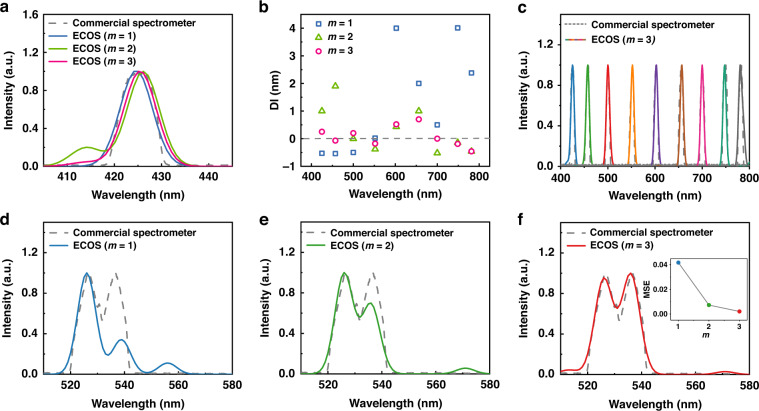
Fig. 4. Tunability of the spectra resolution under different detection modes.
a Reconstruction of a single spectral peak at 425 nm. b The differences in the peak wavelength between reconstruction and reference spectra. c Reconstructed spectra of nine monochromatic lights over the entire operating wavelength range reconstructed with m = 3. d–f Reconstructions of the spectrum with two mixed peaks. The inset of (f) shows the mean square error (MSE) of different modes of m. Here m denotes different detection modes: ‘m = 1 (blue)’ refers to the usage of only ‘0 V’, ‘m = 2 (green)’ refers to the usage of ‘0 V’ and ‘−1.2 V’, and ‘m = 3 (red)’ refers to the usage of ‘0 V’, ‘−1.2 V’, and ‘−1.5 V’

