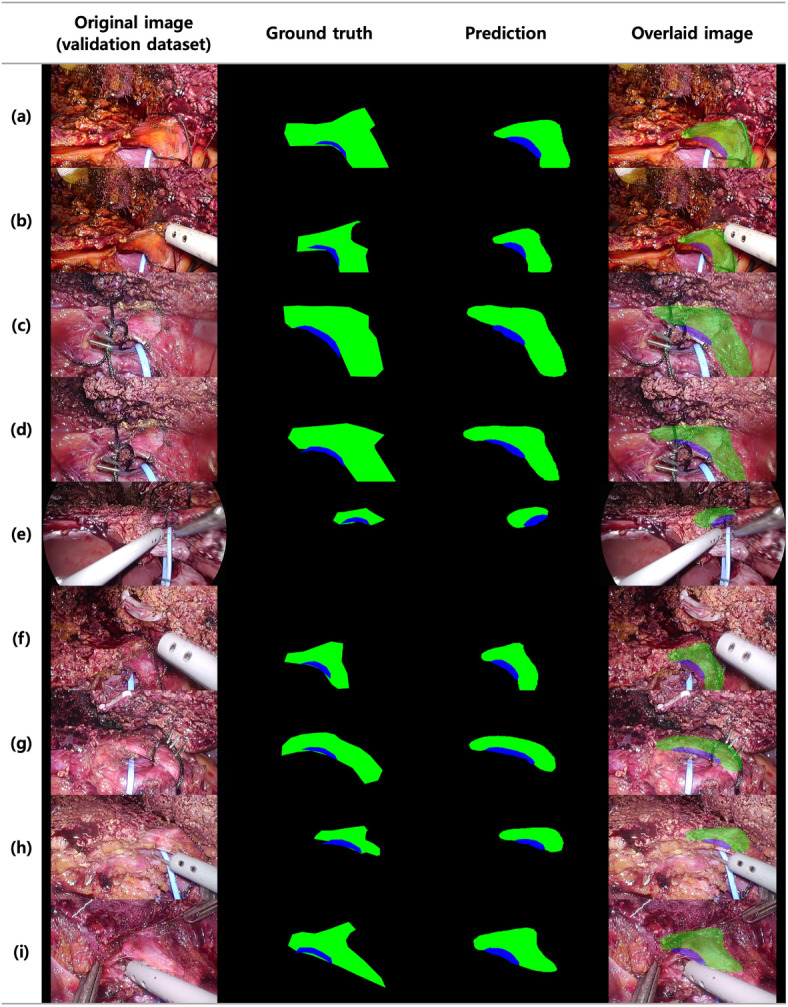
Fig. 3.

Results of segmentation for bile duct (BD) and anterior wall (AW) in the validation set. From left, the first images are original images of the validation set, the second are the ground truth of the target area (BD, AW) corresponding to the original images, the third are the predicted image by the deep learning model after receiving the original image as an input. The fourth images are the predicted images overlaid onto the original images. Black corresponds to the background, blue to BD, and green to AW. For further insights into the interpretability of these results, please refer to supplementary Fig. 1, which provides heatmap visualizations to enhance the understanding of the segmentation outcomes.
