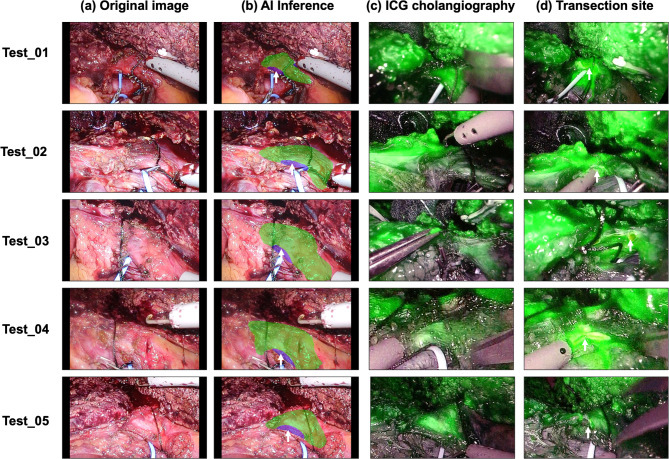
Fig. 4.
Comparison between the results inferred by the AI model and ICG cholangiography on the test set. The following five examples showcase the results obtained by the proposed AI model when applied to videos it had never seen during the training process. (a) Original image, (b) The AI model’s predictions for bile duct (BD) in green and anterior wall (AW) in blue. The white arrows point to the actual transection site as confirmed in (c,d) ICG cholangiography, (d) Image after bile duct transection, with white arrows indicating the site where the bile duct was transected.

