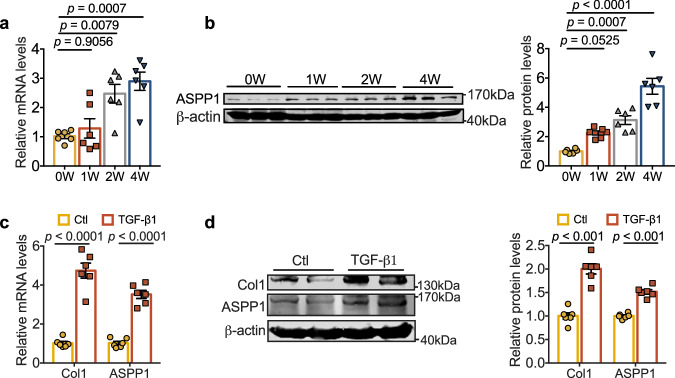
Fig. 1. Upregulation of ASPP1 in fibrotic models.
a, b mRNA and protein of ASPP1 were elevated at 1 week, 2 weeks, and 4 weeks of MI mice. n = 6 independent animals in each group. c mRNA levels of Col1 and ASPP1 in PMCFs treated with TGF-β1 (20 ng/mL), n = 6 independent samples. d Representative immunoblots/densitometric quantitative analysis of Col1 and ASPP1 levels in total lysates of PMCFs treated with TGF-β1 (20 ng/mL). β-actin was used as a loading control, n = 6 independent samples. Data are represented as mean ± SEM. Statistics: one-way ANOVA followed by Tukey post hoc test (a, b). Two-tailed Student’s t-test was used to calculate the presented P values (c, d). Source data are provided as a Source Data file. Ctl control.

