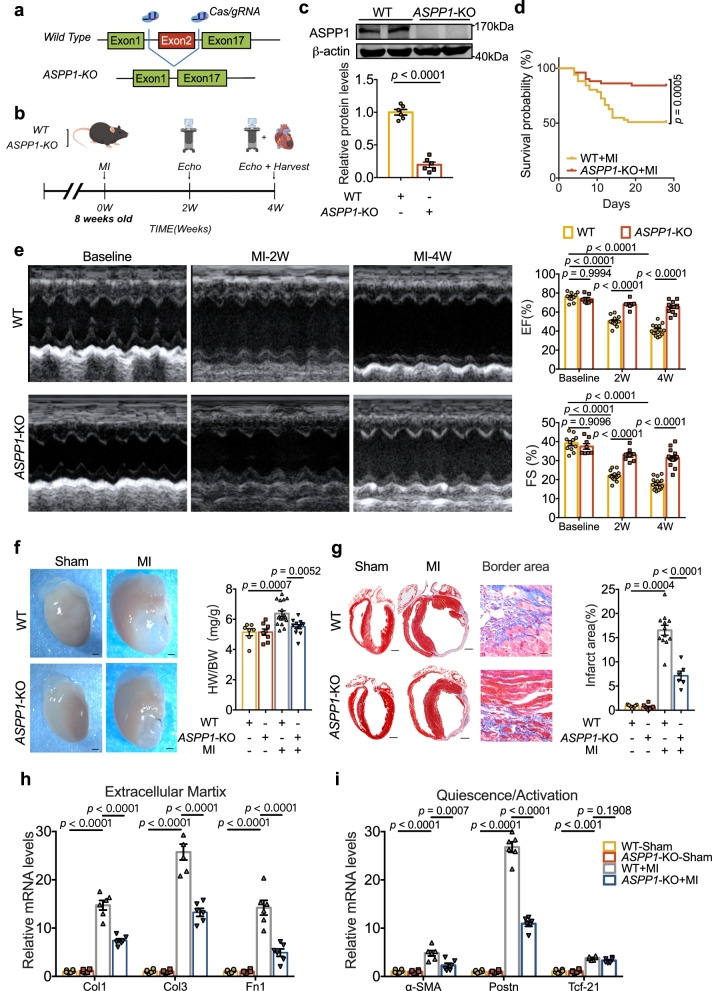
Fig. 2. Global ASPP1 depletion in mice prevents cardiac fibrosis after MI.
a Strategy for the generation of ASPP1 global KO mice. b Schematic diagram of the experiment. Cardiac function was measured at the second and fourth week after MI surgery, and samples were taken at the fourth week. The diagram was created using Figdraw. c ASPP1 protein level in the heart of ASPP1 global KO mice by western blot analysis, n = 6 independent samples in each group. d Kaplan–Meier analysis of the survival of WT (n = 51) and ASPP1-KO mice (n = 51) after MI for 4 weeks. e Echocardiographic measurement of cardiac function. EF ejection fraction, FS fractional shortening; (WT, n = 13; ASPP1-KO, n = 14). f Representative images of the hearts and quantification of the ratio of heart weight (HW) to body weight (BW) in four groups of mice. (WT, n = 7; ASPP1-KO, n = 8; WT-MI, n = 17; ASPP1-KO, n = 12). Scale bar = 1 mm. Magnification 2×. g Coronal cross-section images of Masson’s trichrome staining of the whole heart and heart border area, and statistical analysis of fibrotic area (infarct size) calculated by Image-Pro Plus. (WT, n = 7; ASPP1-KO, n = 8; WT-MI = 12; ASPP1-KO = 6). Scale bar = 1 mm. Magnification 2× in whole heart view group. Scale bar = 5 mm, Magnification 20× in border area part. h, i Transcriptional level of genes encoding ECM (h) and myofibroblast markers molecules (i) in left ventricular tissue at 4 weeks after MI by qRT-PCR, n = 6 independent samples. Data are represented as mean ± SEM. Statistics: Two-tailed Student’s t-test was used to calculate the presented P values (c). Log-rank (Mantel–Cox) test (d). Two-way ANOVA followed by Tukey post hoc test (e). One-way ANOVA, followed by Tukey post hoc multiple comparisons test (f–i). Source data are provided as a Source Data file.

