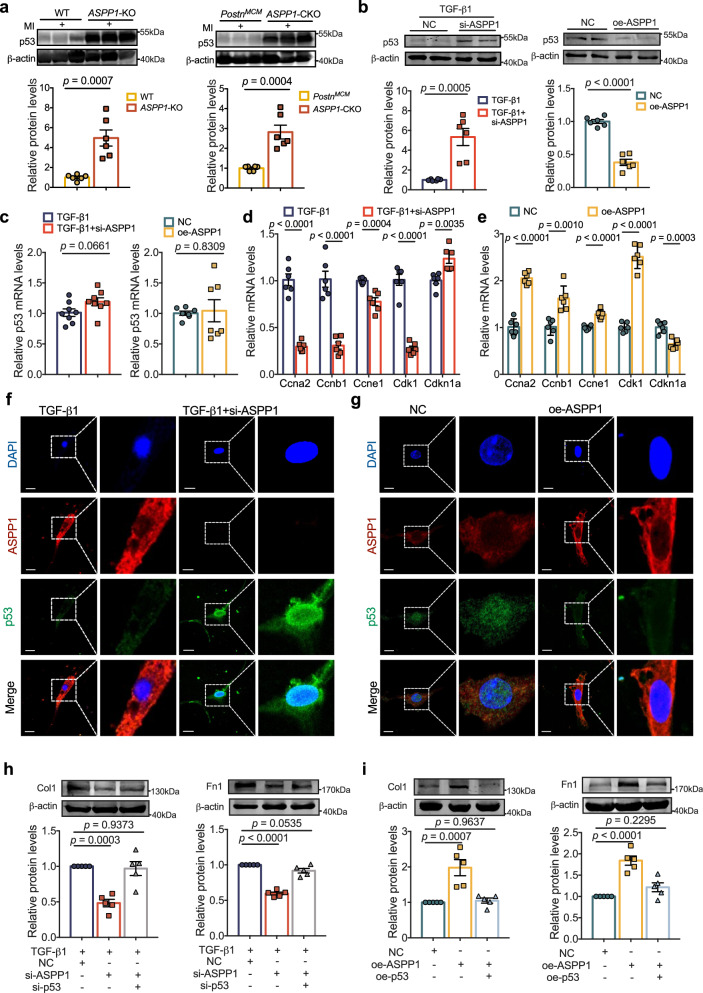
Fig. 5. ASPP1 negatively regulates p53 protein level.
a p53 protein levels in ASPP1-KO group (The left) and ASPP1-CKO group (the right) by western blot assay, n = 6 independent samples in ASPP1-KO group in each group, n = 6 independent samples in ASPP1-CKO group in each group. b Effects of ASPP1 knockdown (si-ASPP1) on TGF-β1-induced (The left) or ASPP1 overexpression (The right) negative regulation of p53 protein levels in PMCFs by western blot analysis, n = 6 independent samples. c Effects of ASPP1 knockdown (si-ASPP1) on TGF-β1-induced (The left) or ASPP1 overexpression (the right) on p53 mRNA levels in PMCFs by qRT-PCR, n = 8 independent samples in si-ASPP1 + TGF-β1 group, n = 7 independent samples in ASPP1 overexpression group. d, e qRT-PCR was used to evaluate the expression of genes encoding cell cycle regulators in PMCFs, n = 6 independent samples in each group. f, g Immunofluorescent staining of ASPP1 and p53 in PMCFs. ASPP1 was stained in red, and p53 in green. The nucleus was stained in blue with DAPI, n = 3 independent experiments. Scale bar = 20 μm. Magnification 60×. h The protein levels of Col1 and Fn1 after co-transfection of si-ASPP1 and the siRNA for p53 (si-p53), n = 5 independent samples in each group. i The effect of Col1 and Fn1 after co-transfection of oe-ASPP1 plasmids and p53 overexpression (oe-p53) plasmids, n = 5 independent samples in each group. Data are represented as mean ± SEM. Statistics: A two-tailed Student’s t-test was used to calculate P values (a–e). One-way ANOVA, followed by Tukey post hoc multiple comparisons test (h, i). Source data are provided as a Source Data file.

