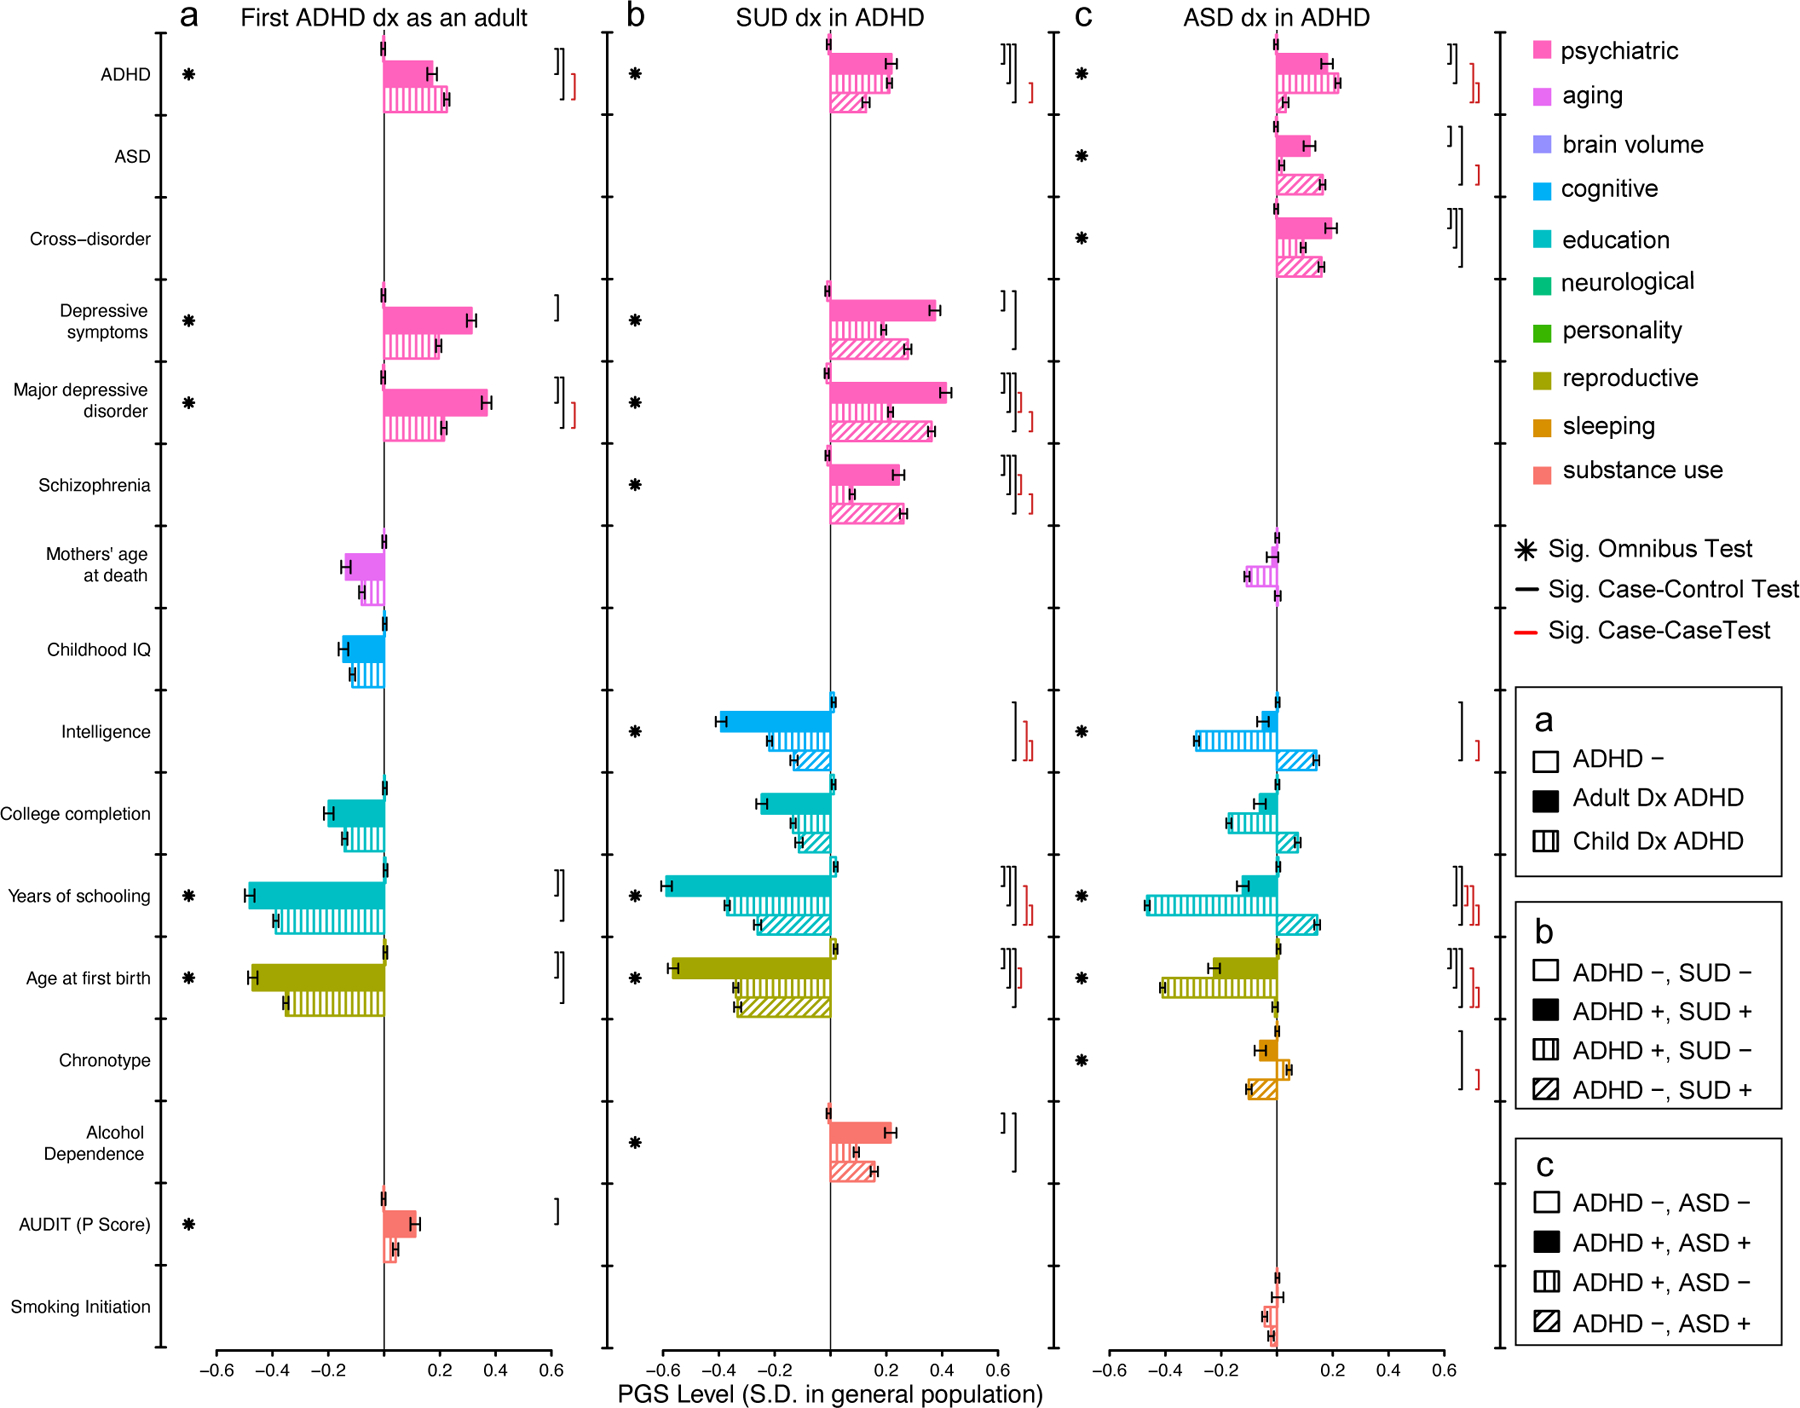
Fig. 4. Profiles of polygenic scores for psychiatric, cognitive, and socio-behavioral traits define aspects of heterogeneity in ADHD.

The mean level of polygenic scores (PGS; bars) are displayed for ADHD subgroups, controls, and complementary disorder groups after centering and standardizing based on a population random sample. a. Individuals not diagnosed with ADHD (ADHD −, n=21 409), first diagnosed as an adult (1st Dx Adult, n=3 323), and first diagnosed as a child (1st Dx Child, n=10 761), b. Individuals diagnosed with neither ADHD, nor SUD (ADHD-, SUD-, n=20 509), both ADHD and SUD (ADHD+, SUD+, n=2 627), ADHD but not SUD (ADHD+, SUD-, n=11 457), and SUD but not ADHD (ADHD-, SUD+, n=5 943), and c. Individuals diagnosed with neither ADHD, nor ASD (ADHD-, ASD-, n=21 197), both ADHD and ASD (ADHD+, ASD+, n=2 284), ADHD but not ASD (ADHD+, ASD-, n=11 800), and ASD but not ADHD (ADHD-, ASD+, n=9 804), vary significantly with respect to multivariate profiles of PGS. Stars denote a significant global test (one-tailed p-value) for differences in PGS level among all groups, while brackets denote significant pairwise group contrasts (two-tailed p-value), accounting for all other PGS and 25 ancestry principle components in a joint multinomial logistic regression. Significance determined by Bonferonni correction, p<0.05/169=0.0003. Error bars denote standard error of mean. See Supplementary tables 18–20 for complete statistical results and Supplementary table 28 for details of reference GWAS used for PGS. ADHD, attention deficit hyperactivity disorder; ASD, autism spectrum disorder; SUD, substance use disorder; Dx, diagnosis; Sig., Significant, PGS, polygenic score.
