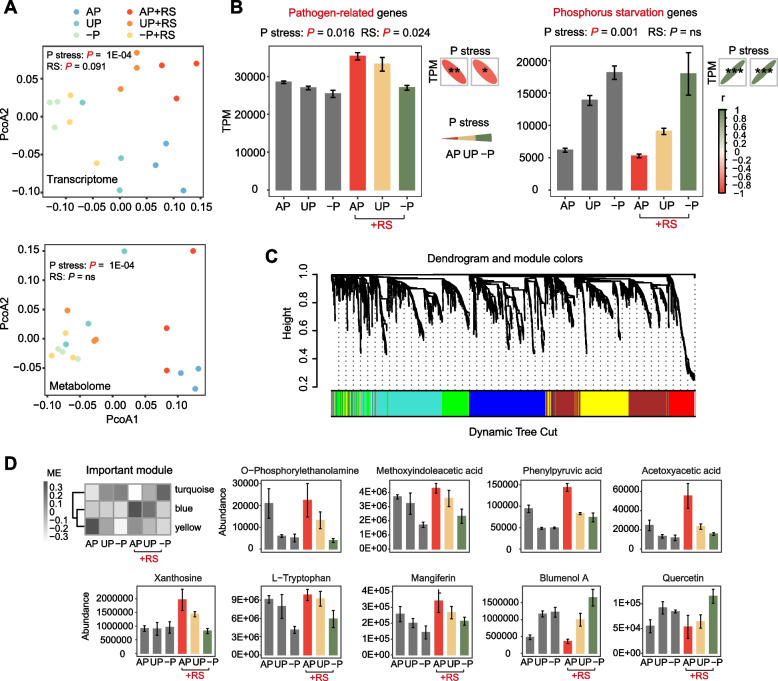
Fig. 4.
Impact of phosphorus and pathogen inoculation on plant transcriptome and metabolome. Phosphorus stress gradually increased in the order of AP, UP, and −P due to different fertilizer treatments. The +RS groups indicated treatments inoculated with the pathogen. A PCoA plot illustrating the distance of the plant transcriptome and metabolome in different treatments. PERMANOVA test evaluated differences due to pathogen inoculation, while the Mantel test assessed the effect of the phosphorus gradient. B The transcripts per million (TPM) of pathogen-related genes and phosphorus starvation genes in different treatments and their correlations with phosphorus stress. Error bars represent standard errors with three replicates. Significance was determined using the Scheirer-Ray-Hare test and Spearman correlations. C Weighted gene co-expression network analysis (WGCNA) network of pathogen-related genes, phosphorus starvation genes, and all root metabolites. Members with similar trends were clustered and further divided into several modules with a minimum member size of 200, which were represented by the colors below. D Dendrogram depicting the key module eigengenes (ME) affected by phosphorus stress and pathogen inoculation. The histogram showing the abundances of key metabolites in the corresponding modules. Error bars represent standard errors with three replicates. “r” stands for Spearman correlation coefficient; P denotes phosphorus. Significance levels are denoted as follows: “ns,” not significant, “.”P < 0.1, “*”P < 0.05, “**”P < 0.01, and “***”P < 0.001

