Figure 3.

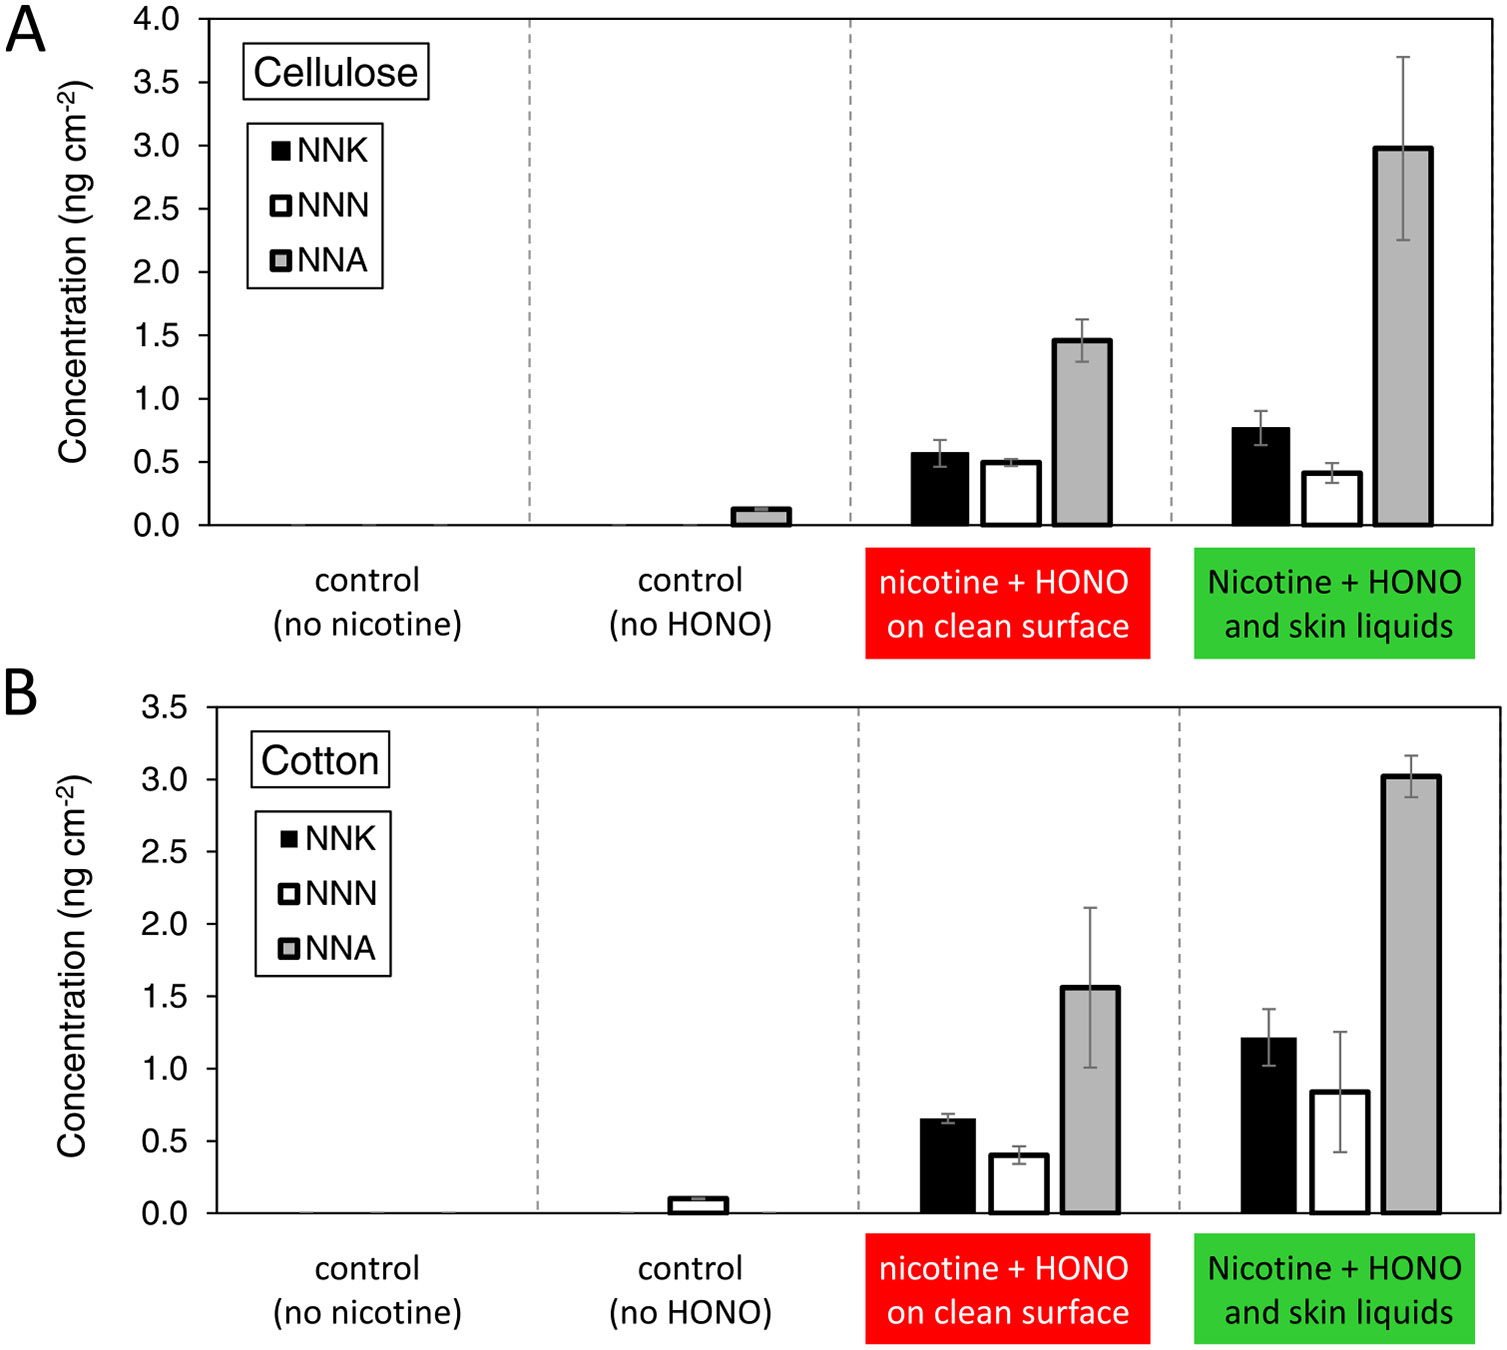
TSNA surface concentration determined in experiments performed with (A) cellulose and (B) cotton specimens. Bars represent the average of two measurements, and the error bars show the absolute difference between determinations.

TSNA surface concentration determined in experiments performed with (A) cellulose and (B) cotton specimens. Bars represent the average of two measurements, and the error bars show the absolute difference between determinations.