
Fig. 16.
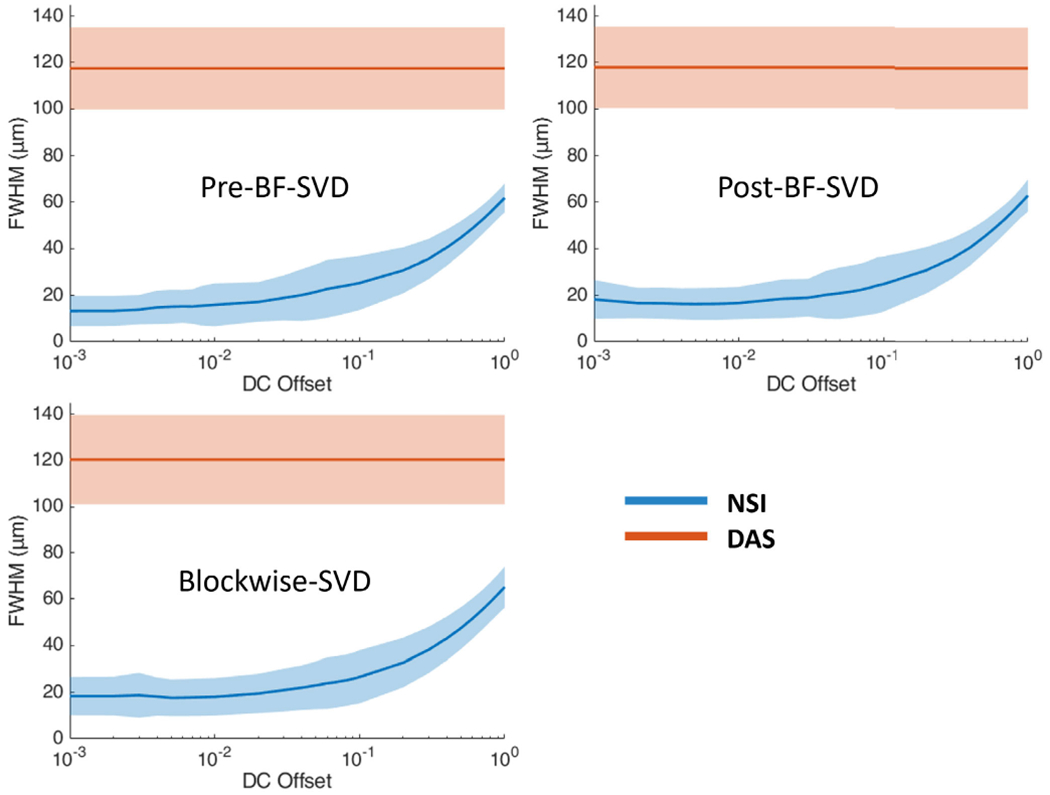
FWHM profile of contrast enhanced rat brain vessels under different clutter filter settings Pre-BF-SVD (top left), Post-BF-SVD (top right) and Blockwise-SVD (bottom left) for both DAS and NSI. The FWHM measurement was taken from the 20 manually picked microbubble traces, which are marked with white solid lines in Fig. 14.