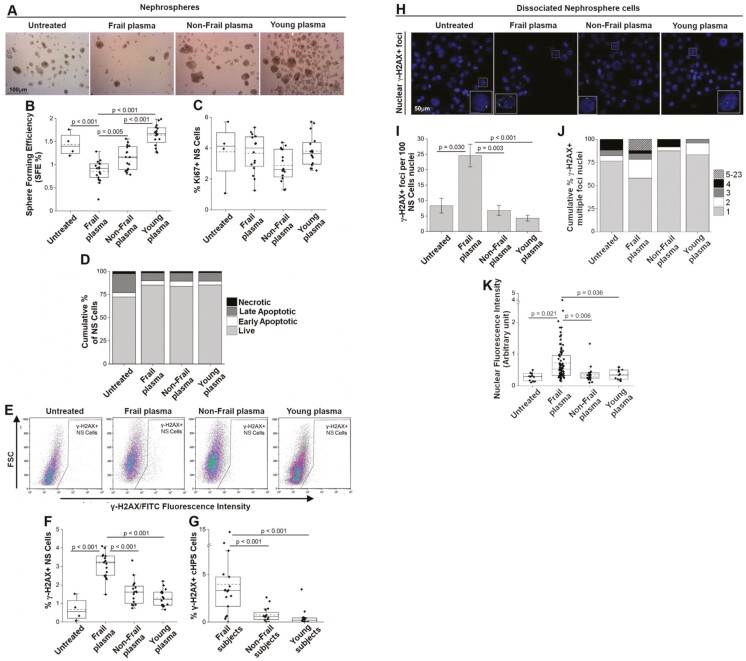
Figure 2.
Effects of 10 days of treatment with plasma from frail, non-frail, and young subjects on NS cells. (A) Phase contrast images representative of renal cells grown as NS, untreated or treated with the indicated plasma. Scale bar: 100 μm. Eleven NS cultures were used (Supplementary Table 2), and the treatments were made with 17 frail, 16 non-frail, and 16 young plasma samples (Supplementary Table 3). (B) Sphere-forming efficiency (SFE %) of renal cells grown as NSs and treated with the indicated plasma; data were obtained with a contrast phase microscope. (C) Percentage of NS cells positive for Ki-67 after the indicated plasma treatment. Flow cytometry data are shown (gating strategy in Supplementary Figure 1). (D) Cumulative percentage of live, early, late apoptotic, and necrotic NS cells after the indicated plasma treatments, flow cytometry data of Annexin V/PI staining are shown (representative dot plots in Supplementary Figure 2); color-code: light gray, live; white, early apoptotic; dark gray, late apoptotic; black, necrotic. (E) Representative flow cytometry dot plots of γ-H2AX+ NS cells treated with the same plasma samples as in Figure 2A. FSC = Forward Scatter (gating strategy in Supplementary Figure 1). (F) Percentage of nuclear DNA-damaged (γ-H2AX+) NS cells after the indicated plasma treatments, flow cytometry data. (G) Percentage of DNA-damaged (γ-H2AX+) cHPSCs (Supplementary Table 4) circulating in the subjects donors of the plasma used in panel F, flow cytometry data. (H) Representative cytospin immunofluorescence analysis of nuclear γ-H2AX+ foci in 3 different independent NS cultures grown with 7 frail, 4 non-frail, and 4 young plasma samples. Ten different fields were evaluated for each specific plasma treatment. Scale bars: 50 μm; zoomed inserts: 10 μm. Nuclei stained by DAPI. (I) Mean ± SEM. of γ-H2AX+ foci per 100 nuclei of untreated or treated NS cells. (J) Cumulative % of γ-H2AX+ multiple-focus nuclei. Color-code: light gray, 1 focus; white, 2 foci; dark gray, 3 foci; black, 4 foci; lines upward right, 5–23 foci per nucleus. (K) γ-H2AX fluorescence intensity per nucleus of NS cells. p < .05 obtained with 1-way ANOVA with Tukey’s test for pairwise multiple comparison was considered significant.

