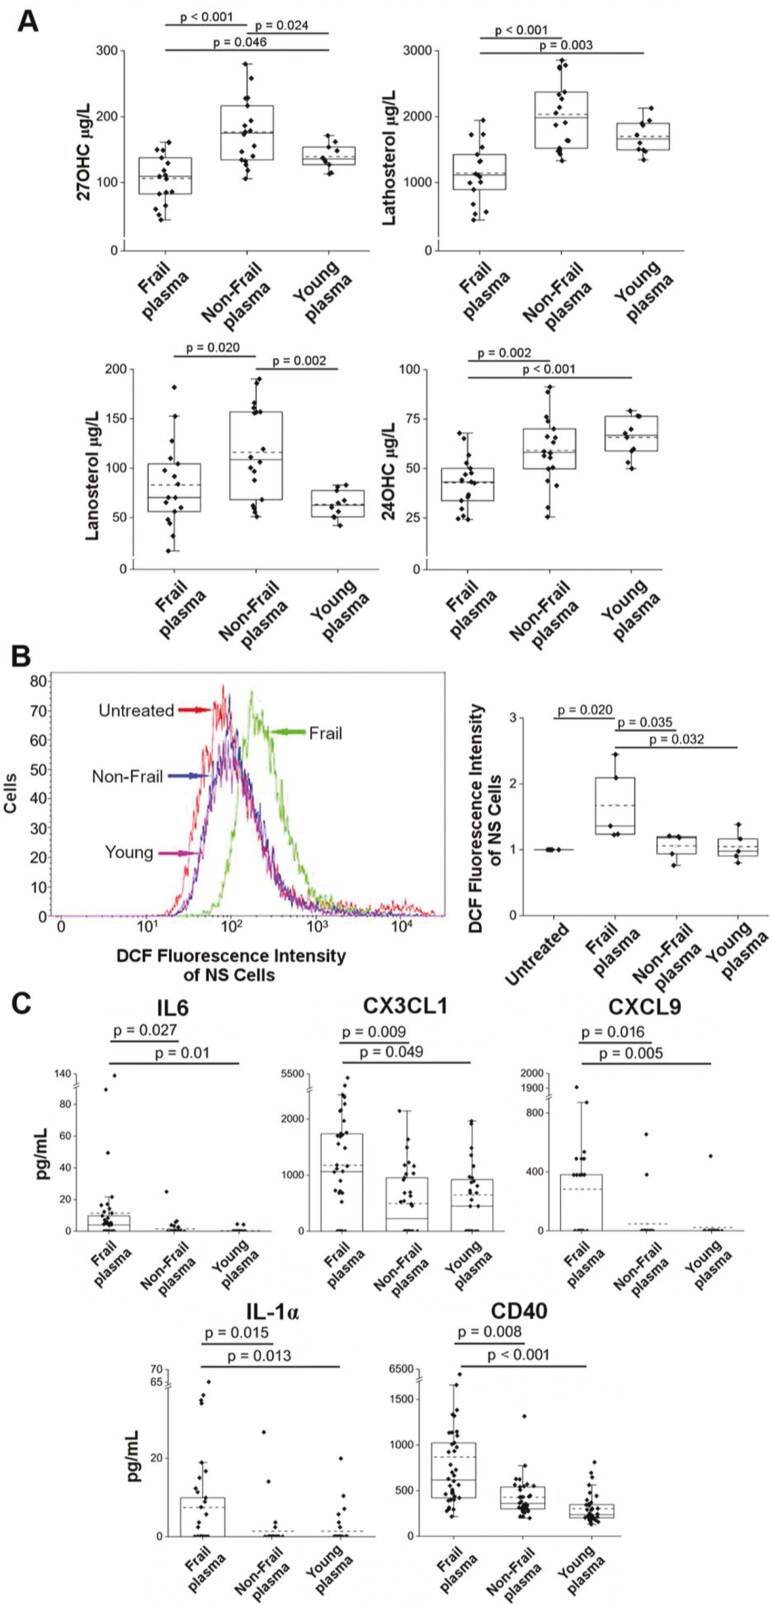
Figure 3.
Plasma oxysterols and cholesterol precursors, intracellular ROS in NS cells, plasma cytokine concentrations. (A) Levels of 27-OHC, lathosterol, lanosterol, and 24-OHC in plasma samples from 17 frail, 18 non-frail, and 10 young individuals (Supplementary Table 5). (B) Left, representative production of intracellular ROS in NS cells with or without treatment with the indicated plasma during growth, flow cytometry analysis of 2ʹ,7ʹ-dichlorofluorescein (DCF) (gating strategy in Supplementary Figure 1). Right, median DCF fluorescence intensity peak in dissociated NS cells of 5 different independent NS cultures, each one treated during growth with individual plasma from a set of 5 frail, 5 non-frail, or 5 young individuals; there were 5 untreated NS cultures (Supplementary Table 6). The DCF median values of plasma-treated cells were normalized to the DCF of corresponding untreated NS cells considered equal to 1. (C) Cytokine concentrations (pg/mL) of IL-6, CX3CL1, CXCL9, IL-1α, and CD40 were significantly higher in frail plasma. Cytokines were evaluated in 38 frail, 34 non-frail, and 36 young subjects by the Human Magnetic Luminex Screening Assay (Supplementary Table 7A). A p value < .05 by 1-way ANOVA with Tukey’s test or Holm‒Sidak’s test for pairwise multiple comparison was considered significant.

